
-
Spread Windows Forms Product Documentation
- Getting Started
-
Developer's Guide
- Understanding the Product
- Working with the Component
- Spreadsheet Objects
- Ribbon Control
- Sheets
- Rows and Columns
- Headers
- Cells
- Cell Types
- Data Binding
- Customizing the Sheet Appearance
- Customizing Interaction in Cells
- Tables
- Understanding the Underlying Models
- Customizing Row or Column Interaction
- Formulas in Cells
- Sparklines
- Keyboard Interaction
- Events from User Actions
- File Operations
- Storing Excel Summary and View
- Printing
- Chart Control
- Customizing Drawing
- Touch Support with the Component
- Spread Designer Guide
- Assembly Reference
- Import and Export Reference
- Version Comparison Reference
Display format
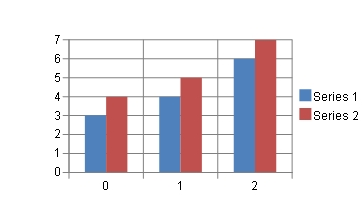
The chart display format can be specified in 2D or 3D. The following image shows a 2D chart.
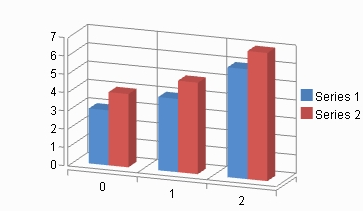
The following image shows an example of a 3D chart.
Using code
Set the ViewType property of the SpreadChart class that represents the chart. Also, you can rotate the plot area around the horizontal and vertical axes as required. You can set the rotation angle around the horizontal axis with the Elevation property of the PlotArea class and the vertical axis with the Rotation property.
Example
The following example demonstrate how to set the chart display format to 3D.
FarPoint.Win.Spread.Chart.SpreadChart chart = new FarPoint.Win.Spread.Chart.SpreadChart();
chart.ViewType = FarPoint.Win.Chart.ChartViewType.View3D;
Dim chart As New FarPoint.Win.Spread.Chart.SpreadChart()
chart.ViewType = FarPoint.Win.Chart.ChartViewType.View3DUsing the Chart Designer
On the Chart Designer, right-click on the chart.
Select [3D Display] or [2D Display] (the displayed items differ depending on the current display format) from the context menu.
!type=note
Note: You can also select a chart on the SPREAD designer and set the ViewType from the View section of the property list on the right side of the screen.