
-
Spread Windows Forms Product Documentation
- Getting Started
-
Developer's Guide
- Understanding the Product
- Working with the Component
- Spreadsheet Objects
- Ribbon Control
- Sheets
- Rows and Columns
- Headers
- Cells
- Cell Types
- Data Binding
- Customizing the Sheet Appearance
- Customizing Interaction in Cells
- Tables
- Pivot Table
- Understanding the Underlying Models
- Customizing Row or Column Interaction
- Formulas in Cells
- Sparklines
- Keyboard Interaction
- Events from User Actions
- File Operations
- Storing Excel Summary and View
- Printing
- Chart Control
- Enhanced Chart
- Customizing Drawing
- Touch Support with the Component
- Spread Designer Guide
- Assembly Reference
- Import and Export Reference
- Version Comparison Reference
Labels
The labels contain the plot title and the axis labels.
Plot Title
You can set the main title for the chart using the Text property in the LabelArea class.
Axis Label
You can set the text, alignment, and other formatting properties for the axis labels. See the following for more information:
The label text can be bound to a data source with the TitleDataSource and TitleDataField properties.
The following example sets the chart and axis title.
FarPoint.Win.Chart.YPlotArea plotArea = new FarPoint.Win.Chart.YPlotArea();
plotArea.Location = new System.Drawing.PointF(0.2f, 0.2f);
plotArea.Size = new System.Drawing.SizeF(0.6f, 0.6f);
//Sets the Axis label
plotArea.XAxis.Title = "Categories";
plotArea.YAxes[0].Title = "Values";
plotArea.YAxes[0].TitleTextDirection = FarPoint.Win.Chart.TextDirection.Rotate270Degree;
plotArea.Series.Add(series1);
//Sets chart title
FarPoint.Win.Chart.LabelArea labelArea = new FarPoint.Win.Chart.LabelArea();
labelArea.Location = new System.Drawing.PointF(0.5f, 0.02f);
labelArea.AlignmentX = 0.5f;
labelArea.AlignmentY = 0.0f;
labelArea.Text = "The Chart";
Dim plotArea As New FarPoint.Win.Chart.YPlotArea()
plotArea.Location = New System.Drawing.PointF(0.2F, 0.2F)
plotArea.Size = New System.Drawing.SizeF(0.6F, 0.6F)
'Sets the Axis label
plotArea.XAxis.Title = "Categories"
plotArea.YAxes(0).Title = "Values"
plotArea.YAxes(0).TitleTextDirection = FarPoint.Win.Chart.TextDirection.Rotate270Degree
plotArea.Series.Add(series1)
'Sets chart title
Dim labelArea As New FarPoint.Win.Chart.LabelArea()
labelArea.Location = New System.Drawing.PointF(0.5F, 0.02F)
labelArea.AlignmentX = 0.5F
labelArea.AlignmentY = 0F
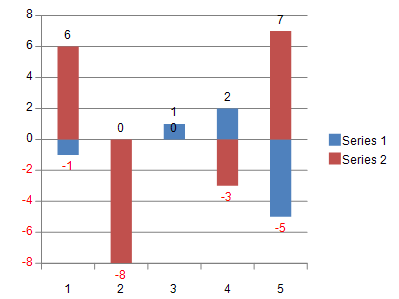
labelArea.Text = "The Chart"Display Negative Numbers in Red
The negative data label values and value axis labels of a chart can be displayed in red color.
The Series.LabelNegativeRed and ValueAxis.LabelNegativeRed properties can be set to True to display the negative values in red.
The properties show the following behavior:
When the data label contains parts such as Series Name, along with negative values, the red font color will be applied to them as well.
When the data label does not show value, the property loses its effect.
The X Index Axis does not allow negative numbers.
This feature is not applicable to whisker and waterfall charts.
The following code shows how to apply LabelNegativeRed property to display negative label values in red.
var worksheet = fpSpread1_Sheet1.AsWorksheet();

worksheet.Cells[0, 0].Value = -1;
worksheet.Cells[1, 0].Value = 0;
worksheet.Cells[2, 0].Value = 1;
worksheet.Cells[3, 0].Value = 2;
worksheet.Cells[4, 0].Value = -5;
worksheet.Cells[0, 1].Value = 6;
worksheet.Cells[1, 1].Value = -8;
worksheet.Cells[2, 1].Value = 0;
worksheet.Cells[3, 1].Value = -3;
worksheet.Cells[4, 1].Value = 7;

FarPoint.Win.Spread.Model.CellRange range = new FarPoint.Win.Spread.Model.CellRange(0, 0, 5, 2);

FarPoint.Win.Spread.Chart.SpreadChart chart = fpSpread1.Sheets[0].AddChart(range, typeof(FarPoint.Win.Chart.BarSeries), 400, 300, 200, 50);

FarPoint.Win.Chart.BarSeries series = (FarPoint.Win.Chart.BarSeries)chart.Model.PlotAreas[0].Series[0];
FarPoint.Win.Chart.BarSeries series1 = (FarPoint.Win.Chart.BarSeries)chart.Model.PlotAreas[0].Series[1];

// Setting label visible for data label in series 0
series.LabelVisible = true;
series.LabelNegativeRed = true; // Setting LabelNegativeRed as true

// Setting label visible for data label in series 1
series1.LabelVisible = true;
series1.LabelNegativeRed = true;

FarPoint.Win.Chart.YPlotArea plotArea = (FarPoint.Win.Chart.YPlotArea)chart.Model.PlotAreas[0];

// Setting label visible for value axis
plotArea.YAxes[0].LabelVisible = true;
plotArea.YAxes[0].LabelNegativeRed = true; // Setting LabelNegativeRed as true
Dim worksheet = FpSpread1_Sheet1.AsWorksheet()
worksheet.Cells(0, 0).Value = -1
worksheet.Cells(1, 0).Value = 0
worksheet.Cells(2, 0).Value = 1
worksheet.Cells(3, 0).Value = 2
worksheet.Cells(4, 0).Value = -5
worksheet.Cells(0, 1).Value = 6
worksheet.Cells(1, 1).Value = -8
worksheet.Cells(2, 1).Value = 0
worksheet.Cells(3, 1).Value = -3
worksheet.Cells(4, 1).Value = 7
Dim range As FarPoint.Win.Spread.Model.CellRange = New FarPoint.Win.Spread.Model.CellRange(0, 0, 5, 2)
Dim chart As FarPoint.Win.Spread.Chart.SpreadChart = FpSpread1.Sheets(0).AddChart(range, GetType(FarPoint.Win.Chart.BarSeries), 400, 300, 200, 50)
Dim series As FarPoint.Win.Chart.BarSeries = CType(chart.Model.PlotAreas(0).Series(0), FarPoint.Win.Chart.BarSeries)
Dim series1 As FarPoint.Win.Chart.BarSeries = CType(chart.Model.PlotAreas(0).Series(1), FarPoint.Win.Chart.BarSeries)
'Setting label visible for data label in series 0
series.LabelVisible = True
series.LabelNegativeRed = True 'Setting LabelNegativeRed as true
'Setting label visible for data label in series 1
series1.LabelVisible = True
series1.LabelNegativeRed = True 'Setting LabelNegativeRed as true
Dim plotArea As FarPoint.Win.Chart.YPlotArea = CType(chart.Model.PlotAreas(0), FarPoint.Win.Chart.YPlotArea)
'Setting label visible for value axis
plotArea.YAxes(0).LabelVisible = True
plotArea.YAxes(0).LabelNegativeRed = True 'Setting LabelNegativeRed as trueExcelIO supports negative red numbers by using the general formatter property. For example, you can use the following format code "#,0;[Red]-#,0" in Spread before exporting to Excel, where the positive and negative formats are separated by a semi-colon and the negative values are set to display in red.
The following code shows how to export a chart and display negative label values in red.
// To export negative values in red
FarPoint.Win.Spread.Model.GeneralFormatter formatter = new FarPoint.Win.Spread.Model.GeneralFormatter();
formatter.SetFormatString("#,0;[Red]-#,0", false);

series.LabelFormatter = formatter;

fpSpread1.SaveExcel("label-chart.xlsx", FarPoint.Excel.ExcelSaveFlags.UseOOXMLFormat | FarPoint.Excel.ExcelSaveFlags.Exchangeable);
'To export negative values in red
Dim formatter As FarPoint.Win.Spread.Model.GeneralFormatter = New FarPoint.Win.Spread.Model.GeneralFormatter()
formatter.SetFormatString("#,0;[Red]-#,0", False)
series.LabelFormatter = formatter
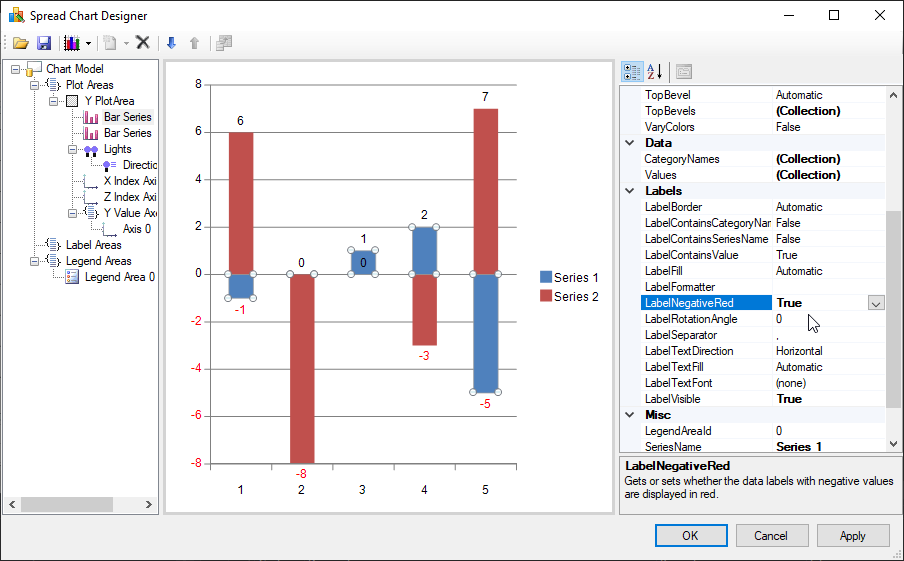
FpSpread1.SaveExcel("label-chart.xlsx", FarPoint.Excel.ExcelSaveFlags.UseOOXMLFormat Or FarPoint.Excel.ExcelSaveFlags.Exchangeable)Using the Chart Designer
Run the Chart Designer.
Expand the target Plot Area from the tree menu on the left.
Select X Index Axis and set the required properties in the property list on the right.
Expand Y Value Axis, select Axis0, and set the required properties in the Title section of the property list on the right.
Click OK and exit Chart Designer.
You can also enable showing negative labels in red in the Chart Designer by selecting the Bar Series target from the tree menu on the left and enable the LabelNegativeRed option to True on the property list.
!type=note
Note: For information on starting Chart Designer, refer to Chart Designer in the SPREAD Designer Guide.