
-
Spread Windows Forms 18 Product Documentation
- Getting Started
-
Developer's Guide
- Understanding the Product
- Working with the Component
- Spreadsheet Objects
- Ribbon Control
- Sheets
- Rows and Columns
- Headers
- Cells
- Cell Types
- Data Binding
- Customizing the Sheet Appearance
- Customizing Interaction in Cells
- Tables
- Understanding the Underlying Models
- Customizing Row or Column Interaction
- Formulas in Cells
- Sparklines
- Keyboard Interaction
- Events from User Actions
- File Operations
- Storing Excel Summary and View
- Printing
- Chart Control
- Customizing Drawing
- Touch Support with the Component
- Spread Designer Guide
- Assembly Reference
- Import and Export Reference
- Version Comparison Reference
Funnel Charts
A funnel chart shows values across multiple stages. The values typically decrease at each stage.
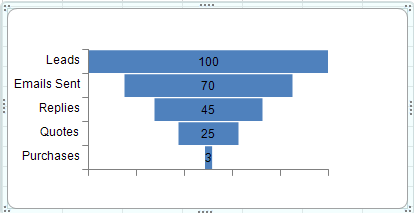
Funnel charts are useful for sales and other types of data. For example, determining how many web site visits lead to product purchases.
You can use the FunnelSeries class and the YPlotArea class to add a funnel chart.
For information about creating charts in the Spread Designer or the Chart Designer, refer to Using the Chart Control on sheet or Adding a Chart Control.
Using Code
Add data for the chart with the FunnelSeries class.
Specify the plot area using the YPlotArea class.
Set the position and size of the plot area.
Add a series to the plot area.
Create a chart model and add the plot area to this model.
Create a chart and set a chart model for this chart.
Add the chart to SPREAD.
Example
This example creates a funnel chart.
FarPoint.Win.Chart.FunnelSeries funnel= new FarPoint.Win.Chart.FunnelSeries();
                funnel.Values.Add(100);
                funnel.Values.Add(70);
                funnel.Values.Add(45);
                funnel.Values.Add(25);
                funnel.Values.Add(3);
                funnel.CategoryNames.Add("Leads");
                funnel.CategoryNames.Add("Emails Sent");
                funnel.CategoryNames.Add("Replies");
                funnel.CategoryNames.Add("Quotes");
                funnel.CategoryNames.Add("Purchases");

                FarPoint.Win.Chart.YPlotArea plotArea = new FarPoint.Win.Chart.YPlotArea();
                plotArea.Location = new PointF(0.2f, 0.2f);
                plotArea.Size = new SizeF(0.6f, 0.6f);
                plotArea.Series.Add(funnel);
                FarPoint.Win.Chart.ChartModel model = new FarPoint.Win.Chart.ChartModel();
                model.PlotAreas.Add(plotArea);
                FarPoint.Win.Spread.Chart.SpreadChart chart = new FarPoint.Win.Spread.Chart.SpreadChart();
                chart.Model = model;
                chart.Left = 0;
                chart.Top = 150;
                chart.Size = new Size(400, 200);
                fpSpread1.ActiveSheet.Charts.Add(chart);
Dim funnel As New FarPoint.Win.Chart.FunnelSeries()
funnel.Values.Add(100)
funnel.Values.Add(70)
funnel.Values.Add(45)
funnel.Values.Add(25)
funnel.Values.Add(3)
funnel.CategoryNames.Add("Leads")
funnel.CategoryNames.Add("Emails Sent")
funnel.CategoryNames.Add("Replies")
funnel.CategoryNames.Add("Quotes")
funnel.CategoryNames.Add("Purchases")
Dim plotArea As New FarPoint.Win.Chart.YPlotArea()
plotArea.Location = New PointF(0.2F, 0.2F)
plotArea.Size = New SizeF(0.6F, 0.6F)
plotArea.Series.Add(funnel)
Dim model As New FarPoint.Win.Chart.ChartModel()
model.PlotAreas.Add(plotArea)
Dim chart As New FarPoint.Win.Spread.Chart.SpreadChart()
chart.Model = model
chart.Left = 0
chart.Top = 150
chart.Size = New Size(400, 200)
fpSpread1.ActiveSheet.Charts.Add(chart)