
-
Spread Windows Forms Product Documentation
- Getting Started
-
Developer's Guide
- Understanding the Product
- Working with the Component
- Spreadsheet Objects
- Ribbon Control
- Sheets
- Rows and Columns
- Headers
- Cells
- Cell Types
- Data Binding
- Customizing the Sheet Appearance
- Customizing Interaction in Cells
- Tables
- Pivot Table
- Understanding the Underlying Models
- Customizing Row or Column Interaction
- Formulas in Cells
- Sparklines
- Keyboard Interaction
- Events from User Actions
- File Operations
- Storing Excel Summary and View
- Printing
- Chart Control
- Enhanced Chart
- Customizing Drawing
- Touch Support with the Component
- Spread Designer Guide
- Assembly Reference
- Import and Export Reference
- Version Comparison Reference
Y Plot Types
The Y plot area contains series that have values in one dimension.
When visualized in 2D, a Y plot area takes the form of a rectangle with the x-axis representing categories and the y-axis representing values.
When visualized in 3D, a Y plot area takes the form of a cube with the x-axis representing categories, the y-axis representing values, and the z-axis (depth) representing series.
A Y plot area can be oriented vertically or horizontally. When oriented vertically, the x-axis is horizontal and the y-axis is vertical. When oriented horizontally, the x-axis is vertical and the y-axis is horizontal.
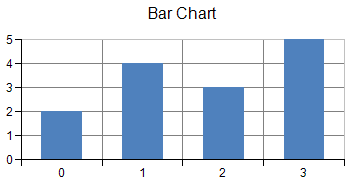
The following image depicts a bar chart.
You can have any of these types of Y plots.
- Bar Charts
- Area Charts
- Box Whisker Charts
- Funnel Charts
- Histogram Charts
- Line Charts
- Market Data (High-Low) Charts
- Pareto Charts
- Point Charts
- Stripe Charts
- Waterfall Charts
For more information, see the YPlotArea class.