
-
Spread Windows Forms Product Documentation
- Getting Started
-
Developer's Guide
- Understanding the Product
- Working with the Component
- Spreadsheet Objects
- Ribbon Control
- Sheets
- Rows and Columns
- Headers
- Cells
- Cell Types
- Data Binding
- Customizing the Sheet Appearance
- Customizing Interaction in Cells
- Tables
- Pivot Table
- Understanding the Underlying Models
- Customizing Row or Column Interaction
- Formulas in Cells
- Sparklines
- Keyboard Interaction
- Events from User Actions
- File Operations
- Storing Excel Summary and View
- Printing
- Chart Control
- Enhanced Chart
- Customizing Drawing
- Touch Support with the Component
- Spread Designer Guide
- Assembly Reference
- Import and Export Reference
- Version Comparison Reference
Working with Sparklines
Spread for Winforms provides various sparkline-related operations. You can perform group, delete, cut, copy, and switch rows and columns operations on column, line, and winloss sparklines, which are created by using methods.
Basic operations
You can use standard Windows shortcut keys to cut, copy, or paste sparklines.
When copying or deleting a group of sparklines:
If you copy a group of sparklines, they will become a new group when they are pasted to a new location.
Copying a single sparkline from a group, will create a new group with a single sparkline.
If you delete a group, all sparklines in the group are also deleted.
You can clear a sparkline with the ClearSparklines method in the Sheetview class.
The range of data used in the sparkline can be switched from row to column or column to row using the SwitchRowColumn method. The data range should have the same number of rows and columns.
Use the AddSquareSparkline method in the SheetView class to add a sparkline that can be switched.
Group Sparklines
Grouping merges sparklines into a new group and removes them from the old groups. You can use the GroupSparkline method to group sparkline cells.
The data and location range of the original sparkline are used in the new groups. The settings of the original group are also used in the new groups.
If the selected sparklines belong to different groups with different types, the new group will have the type of the last selected group. The new group will also have the empty cell, style, and axis settings of the last selected group.
Ungrouping selected sparkline groups separates them into different groups that contain only one sparkline. You can use the UnGroupSparkline method to ungroup sparkline cells.
The following example shows how to use the GroupSparkline method or the UnGroupSparkline method.
FarPoint.Win.Spread.SheetView sv = new FarPoint.Win.Spread.SheetView();
private void Form1_Load(object sender, EventArgs e)
{
FarPoint.Win.Spread.Chart.SheetCellRange test = new FarPoint.Win.Spread.Chart.SheetCellRange(sv, 0, 0, 2, 4);
FarPoint.Win.Spread.Model.CellRange data2 = new FarPoint.Win.Spread.Model.CellRange(0, 5, 2, 1);
FarPoint.Win.Spread.ExcelSparklineSetting ex = new FarPoint.Win.Spread.ExcelSparklineSetting();
ex.ShowFirst = true;
ex.FirstMarkerColor = Color.Violet;
fpSpread1.Sheets[0] = sv;
sv.Cells[0, 0].Value = 2;
sv.Cells[0, 1].Value = 5;
sv.Cells[0, 2].Value = 4;
sv.Cells[0, 3].Value = -1;
sv.Cells[0, 4].Value = 3;
sv.Cells[1, 0].Value = 3;
sv.Cells[1, 1].Value = 1;
sv.Cells[1, 2].Value = 2;
sv.Cells[1, 3].Value = -1;
sv.Cells[1, 4].Value = 5;

sv.Cells[2, 0].Value = 3;
sv.Cells[2, 1].Value = 1;
sv.Cells[2, 2].Value = 2;
sv.Cells[2, 3].Value = -1;
sv.Cells[2, 4].Value = 5;
fpSpread1.Sheets[0].AddSparkline(test, data2, FarPoint.Win.Spread.SparklineType.Column, ex);

FarPoint.Win.Spread.Chart.SheetCellRange test1 = new FarPoint.Win.Spread.Chart.SheetCellRange(sv, 2, 0, 1, 4);
FarPoint.Win.Spread.Model.CellRange data3 = new FarPoint.Win.Spread.Model.CellRange(2, 5, 1, 1);
FarPoint.Win.Spread.ExcelSparklineSetting ex1 = new FarPoint.Win.Spread.ExcelSparklineSetting();
ex1.FirstMarkerColor = Color.Red;
ex1.ShowFirst = true;
fpSpread1.Sheets[0].AddSparkline(test1, data3, FarPoint.Win.Spread.SparklineType.Column, ex1);

sv.Cells[4, 0].Value = 2;
sv.Cells[4, 1].Value = 1;
sv.Cells[5, 0].Value = 5;
sv.Cells[5, 1].Value = 3;
FarPoint.Win.Spread.Chart.SheetCellRange newdata = new FarPoint.Win.Spread.Chart.SheetCellRange(sv, 4, 0, 2, 2);
FarPoint.Win.Spread.Model.CellRange newlocation = new FarPoint.Win.Spread.Model.CellRange(6, 0, 1, 2);
FarPoint.Win.Spread.ExcelSparklineSetting ex2 = new FarPoint.Win.Spread.ExcelSparklineSetting();
fpSpread1.Sheets[0].AddSquareSparkline(newdata, newlocation, FarPoint.Win.Spread.SparklineType.Column, ex2, true);
}

private void button1_Click(object sender, EventArgs e)
        {

fpSpread1.Sheets[0].GroupSparkline(new FarPoint.Win.Spread.Model.CellRange[] { new FarPoint.Win.Spread.Model.CellRange(5, 0, 3, 1) });
// fpSpread1.Sheets[0].UnGroupSparkline(new FarPoint.Win.Spread.Model.CellRange[] { new FarPoint.Win.Spread.Model.CellRange(5, 0, 3, 1) });
}
Dim sv As New FarPoint.Win.Spread.SheetView()
Private Sub Form1_Load(ByVal sender As System.Object, ByVal e As System.EventArgs) Handles MyBase.Load
Dim data2 As New FarPoint.Win.Spread.Chart.SheetCellRange(sv, 0, 0, 2, 4)
Dim test As New FarPoint.Win.Spread.Model.CellRange(0, 5, 2, 1)
Dim ex As New FarPoint.Win.Spread.ExcelSparklineSetting()
ex.ShowFirst = True
ex.FirstMarkerColor = Color.Violet
fpSpread1.Sheets(0) = sv
sv.Cells(0, 0).Value = 2
sv.Cells(0, 1).Value = 5
sv.Cells(0, 2).Value = 4
sv.Cells(0, 3).Value = -1
sv.Cells(0, 4).Value = 3
sv.Cells(1, 0).Value = 3
sv.Cells(1, 1).Value = 1
sv.Cells(1, 2).Value = 2
sv.Cells(1, 3).Value = -1
sv.Cells(1, 4).Value = 5
sv.Cells(2, 0).Value = 3
sv.Cells(2, 1).Value = 1
sv.Cells(2, 2).Value = 2
sv.Cells(2, 3).Value = -1
sv.Cells(2, 4).Value = 5
fpSpread1.Sheets(0).AddSparkline(data2, test, FarPoint.Win.Spread.SparklineType.Column, ex)
Dim data3 = New FarPoint.Win.Spread.Chart.SheetCellRange(sv, 2, 0, 1, 4)
Dim test1 = New FarPoint.Win.Spread.Model.CellRange(2, 5, 1, 1)
Dim ex1 As New FarPoint.Win.Spread.ExcelSparklineSetting()
ex1.FirstMarkerColor = Color.Red
ex1.ShowFirst = True
fpSpread1.Sheets(0).AddSparkline(data3, test1, FarPoint.Win.Spread.SparklineType.Column, ex1)
sv.Cells(4, 0).Value = 2
sv.Cells(4, 1).Value = 1
sv.Cells(5, 0).Value = 5
sv.Cells(5, 1).Value = 3
Dim newdata = New FarPoint.Win.Spread.Chart.SheetCellRange(sv, 4, 0, 2, 2)
Dim newlocation = New FarPoint.Win.Spread.Model.CellRange(6, 0, 1, 2)
Dim ex2 As New FarPoint.Win.Spread.ExcelSparklineSetting()
fpSpread1.Sheets(0).AddSquareSparkline(newdata, newlocation, FarPoint.Win.Spread.SparklineType.Column, ex2, True)
End Sub
Private Sub Button1_Click(ByVal sender As System.Object, ByVal e As System.EventArgs) Handles Button1.Click
fpSpread1.Sheets(0).GroupSparkline(New FarPoint.Win.Spread.Model.CellRange() {New FarPoint.Win.Spread.Model.CellRange(5, 0, 3, 1)})
'fpSpread1.Sheets(0).UnGroupSparkline(New FarPoint.Win.Spread.Model.CellRange() {New FarPoint.Win.Spread.Model.CellRange(5, 0, 3, 1)})
End SubUsing the Spread Designer
Select the sparkline cells.
Select Group or Ungroup in the Group section of the toolbar to group or ungroup sparklines.
Select Clear if you wish to remove any sparklines.
Use the Edit Data option to edit the data or switch the range of data used in the sparkline.
Select Apply and Exit from the File menu to save your changes and close the designer.
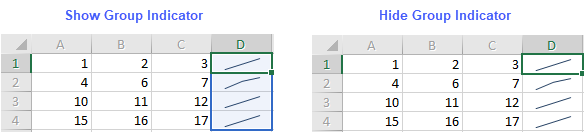
Hide Group Indicator
When you select a sparkline cell present in a group, all the sparklines in that group are highlighted.
Spread for Winforms provides an option to hide the sparkline group indicator when you select a sparkline cell. You can set the SparklineGroupRenderer property to null to hide the indicator.
// Hide sparkline group indicator
fpSpread1.DefaultSkin.SparklineGroupRenderer = null;
'Hide sparkline group indicator
FpSpread1.DefaultSkin.SparklineGroupRenderer = Nothing