
-
Spread Windows Forms Product Documentation
- Getting Started
-
Developer's Guide
- Understanding the Product
- Working with the Component
- Spreadsheet Objects
- Ribbon Control
- Sheets
- Rows and Columns
- Headers
- Cells
- Cell Types
- Data Binding
- Customizing the Sheet Appearance
- Customizing Interaction in Cells
- Tables
- Pivot Table
- Understanding the Underlying Models
- Customizing Row or Column Interaction
- Formulas in Cells
- Sparklines
- Keyboard Interaction
- Events from User Actions
- File Operations
- Storing Excel Summary and View
- Printing
- Chart Control
- Enhanced Chart
- Customizing Drawing
- Touch Support with the Component
- Spread Designer Guide
- Assembly Reference
- Import and Export Reference
- Version Comparison Reference
Add Sparklines Using Methods
You can add a standard column, line, or winloss sparkline to a cell using the AddSparkline method. As shown in the following figure, these sparklines were created using a minimum axis of -8 and a maximum axis of 15.
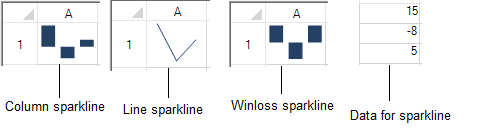
The column sparkline draws the values as a column chart. The line sparkline draws the values as a line chart. The winloss sparkline shows the points with the same size. Negative points extend down from the axis and positive points extend up.
These sparklines can be enhanced by adding other styles and technical properties such as displaying negative points or colors for the marker points as well as colors for high, low, negative, first, and last points. You can set all these using the ExcelSparklineSetting class.
!type=note
Note: You can also add column, loss, or winloss sparklines using formulas. Refer to Column, Line, and Winloss Sparkline for more information.
Example
This example creates a column sparkline in a cell and shows negative and series colors.
FarPoint.Win.Spread.SheetView sv = new FarPoint.Win.Spread.SheetView();
FarPoint.Win.Spread.Chart.SheetCellRange data = new FarPoint.Win.Spread.Chart.SheetCellRange(sv, 0,0,1, 5);
FarPoint.Win.Spread.Chart.SheetCellRange data2 = new FarPoint.Win.Spread.Chart.SheetCellRange(sv, 5,0,1,1);
FarPoint.Win.Spread.ExcelSparklineSetting ex = new FarPoint.Win.Spread.ExcelSparklineSetting();
ex.ShowMarkers = true;
ex.ShowNegative = true;
ex.NegativeColor = Color.Red;
// Use with a Column or Winloss type
ex.SeriesColor = Color.Olive;
fpSpread1.Sheets[0] = sv;
sv.Cells[0, 0].Value = 2;
sv.Cells[0, 1].Value = 5;
sv.Cells[0, 2].Value = 4;
sv.Cells[0, 3].Value = -1;
sv.Cells[0, 4].Value = 3;
fpSpread1.Sheets[0].AddSparkline(data, data2, FarPoint.Win.Spread.SparklineType.Column, ex);
Dim sv As New FarPoint.Win.Spread.SheetView()
Dim data As New FarPoint.Win.Spread.Chart.SheetCellRange(sv, 0, 0, 1, 5)
Dim data2 As New FarPoint.Win.Spread.Chart.SheetCellRange(sv, 5, 0, 1, 1)
Dim ex As New FarPoint.Win.Spread.ExcelSparklineSetting()
ex.ShowMarkers = True
ex.ShowNegative = True
ex.NegativeColor = Color.Red
' Use with a Column or Winloss type
ex.SeriesColor = Color.Olive
fpSpread1.Sheets(0) = sv
sv.Cells(0, 0).Value = 2
sv.Cells(0, 1).Value = 5
sv.Cells(0, 2).Value = 4
sv.Cells(0, 3).Value = -1
sv.Cells(0, 4).Value = 3
fpSpread1.Sheets(0).AddSparkline(data, data2, FarPoint.Win.Spread.SparklineType.Column, ex)Using the Spread Designer
Type data in a cell or a column or row of cells in the designer.
Select a cell for the sparkline.
Select the Insert menu.
Select a sparkline type.
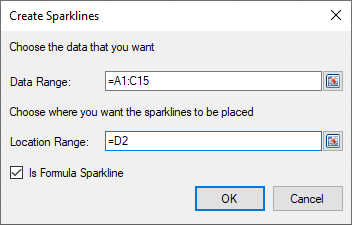
Set the Data Range in the Create Sparklines dialog (such as =Sheet1!$E$1:$E$3). You can also set the range by selecting the cells in the range using the pointer.
Select OK.
Select Apply and Exit from the File menu to save your changes and close the designer.
For more information, see the following topics:
See Also
Specifying Horizontal and Vertical Axes