
-
Spread Windows Forms Product Documentation
- Getting Started
- Developer's Guide
- Spread Designer Guide
- Assembly Reference
- Import and Export Reference
- Version Comparison Reference
Adding Charts
You can add a chart control to the sheet using Spread designer.
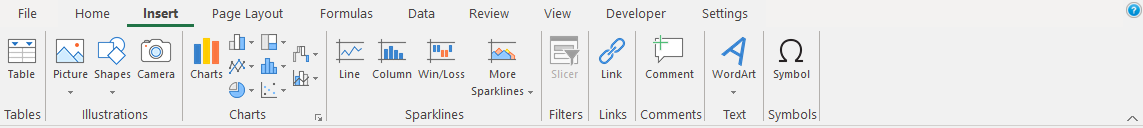
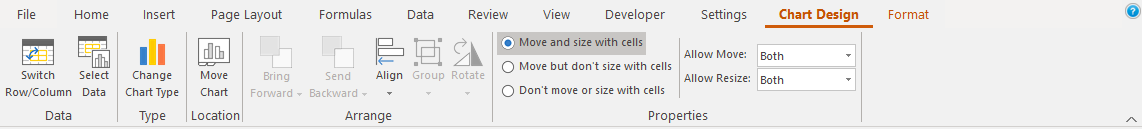
To add a chart control, select Chart section in the Spread Designer under the Insert menu. The second image shows the Chart Design menu option which is displayed after a chart is added.
Use the following steps to add a chart.
Open the Spread Designer and type chart data in the cells (similar to the data in the code example after this section).
Select a range of cells with data.
Click on the Insert menu option and then pick the chart type (see the above image).
The Chart Design menu will appear with additional options.
Close the Spread Designer and save the changes.
After adding a chart, open the Chart Designer for advance settings.