
-
Spread Windows Forms Product Documentation
- Getting Started
-
Developer's Guide
- Understanding the Product
- Working with the Component
- Spreadsheet Objects
- Ribbon Control
- Sheets
- Rows and Columns
- Headers
- Cells
- Cell Types
- Data Binding
- Customizing the Sheet Appearance
- Customizing Interaction in Cells
- Tables
- Pivot Table
- Understanding the Underlying Models
- Customizing Row or Column Interaction
- Formulas in Cells
- Sparklines
- Keyboard Interaction
- Events from User Actions
- File Operations
- Storing Excel Summary and View
- Printing
- Chart Control
- Enhanced Chart
- Customizing Drawing
- Touch Support with the Component
- Spread Designer Guide
- Assembly Reference
- Import and Export Reference
- Version Comparison Reference
Creating a Pie Plot
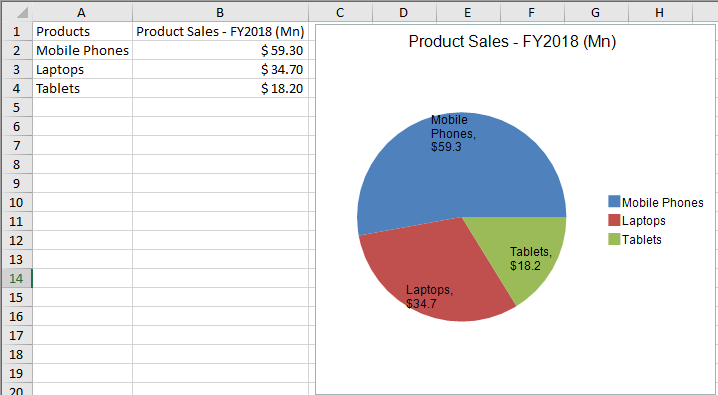
You can create a pie plot chart using code or the designer. The following image shows a Pie Plot type chart for sales of electronic products.
For details on the API, see the PiePlotArea class. Also, to create a pie chart, use the PieSeries class that represents the data series of the circle chart.
!type=note
Note:
To set the pie detachments, set the PieDetachments property of the PieSeries class.
To create a donut chart, set the size of the hole in the center of the circle chart with the HoleSize property of the PiePlotArea class.
Using code
Create a PieSeries object that represents the data series for the circle chart and add the data.
Create a PiePlotArea object that represents the plot area and set its position and size.
Add a data series to the plot area.
Create labels and legend areas.
Create a ChartModel object and add plot areas, labels, and legend areas.
Assign a chart model to the chart.
Example
The following example creates a pie chart to display the annual sales of electronic products (Mobile Phones, Laptops, Tablets) in a store.
// Creating Pie Chart
fpSpread1.Sheets[0].Cells[0, 0].Text = "Products";
fpSpread1.Sheets[0].Cells[1, 0].Text = "Mobile Phones";
fpSpread1.Sheets[0].Cells[2, 0].Text = "Laptops";
fpSpread1.Sheets[0].Cells[3, 0].Text = "Tablets";
fpSpread1.Sheets[0].Cells[0, 1].Text = "Product Sales - FY2018 (Mn)";
fpSpread1.Sheets[0].Cells[1, 1].Value = 59.3;
fpSpread1.Sheets[0].Cells[2, 1].Value = 34.7;
fpSpread1.Sheets[0].Cells[3, 1].Value = 18.2;
CurrencyCellType currencycell = new CurrencyCellType();
currencycell.DecimalPlaces = 2;
currencycell.ShowCurrencySymbol = true;
currencycell.CurrencySymbol = "$";
fpSpread1.Sheets[0].Cells[1, 1, 3, 1].CellType = currencycell;

FarPoint.Win.Spread.Chart.SpreadChart chart = fpSpread1.Sheets[0].AddChart(0, 0, typeof(FarPoint.Win.Chart.PieSeries), 400, 370, 240, 30);
FarPoint.Win.Chart.PieSeries series = (FarPoint.Win.Chart.PieSeries)chart.Model.PlotAreas[0].Series[0];
series.LabelVisible = true;
series.LabelContainsCategoryName = true;
series.LabelContainsValue = true;
// Creating Pie Chart
fpSpread1.Sheets(0).Cells(0, 0).Text = "Products"
fpSpread1.Sheets(0).Cells(1, 0).Text = "Mobile Phones"
fpSpread1.Sheets(0).Cells(2, 0).Text = "Laptops"
fpSpread1.Sheets(0).Cells(3, 0).Text = "Tablets"
fpSpread1.Sheets(0).Cells(0, 1).Text = "Product Sales - FY2018 (Mn)"
fpSpread1.Sheets(0).Cells(1, 1).Value = 59.3
fpSpread1.Sheets(0).Cells(2, 1).Value = 34.7
fpSpread1.Sheets(0).Cells(3, 1).Value = 18.2
Dim currencycell As CurrencyCellType = New CurrencyCellType()
currencycell.DecimalPlaces = 2
currencycell.ShowCurrencySymbol = True
currencycell.CurrencySymbol = "$"
fpSpread1.Sheets(0).Cells(1, 1, 3, 1).CellType = currencycell
Dim chart As FarPoint.Win.Spread.Chart.SpreadChart = fpSpread1.Sheets(0).AddChart(0, 0, GetType(FarPoint.Win.Chart.PieSeries), 400, 370, 240, 30)
Dim series As FarPoint.Win.Chart.PieSeries = CType(chart.Model.PlotAreas(0).Series(0), FarPoint.Win.Chart.PieSeries)
series.LabelVisible = True
series.LabelContainsCategoryName = True
series.LabelContainsValue = TrueYou can also add percentage labels in the pie chart by using LabelContainsPercentage property of the PieSeries class. It accepts boolean value and is false by default.
// Enable Percentage label in pie chart
series.LabelContainsPercentage = true;
// Enable Percentage label in pie chart
series.LabelContainsPercentage = true;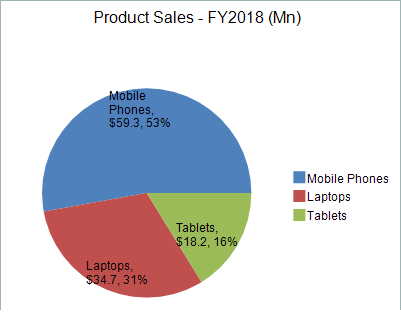
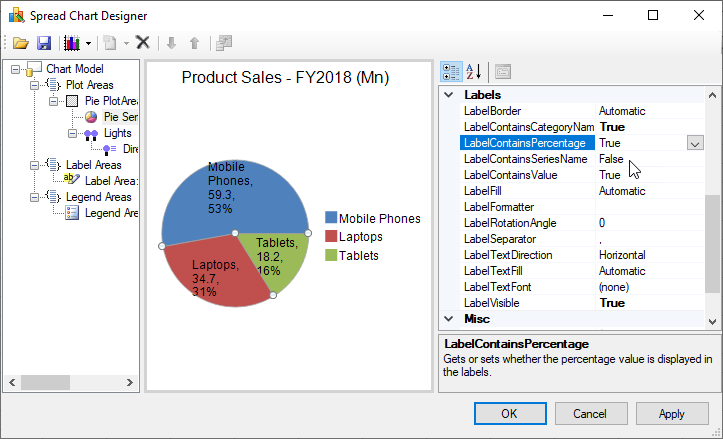
Using the Chart designer
Pie charts can be created in the Chart Designer using the following steps -
Run Chart Designer.
Select the target Chart Model from the tree menu on the left.
Open the Plot Area Collection Editor from PlotAreas in the Other section of the property list on the right.
Click the drop-down button to the right of the Add button.
Select and add the PiePlotArea and set each property as required.
You can also enable percentage labels in the Chart Designer by selecting the Pie Series target from the tree menu on the left and enable the LabelContainsPercentage option to True on the property list.
!type=note
Note: For information on starting Chart Designer, refer to Chart Designer in the SPREAD Designer Guide.