
-
Spread Windows Forms Product Documentation
- Getting Started
-
Developer's Guide
- Understanding the Product
- Working with the Component
- Spreadsheet Objects
- Ribbon Control
- Sheets
- Rows and Columns
- Headers
- Cells
- Cell Types
- Data Binding
- Customizing the Sheet Appearance
- Customizing Interaction in Cells
- Tables
- Pivot Table
- Understanding the Underlying Models
- Customizing Row or Column Interaction
- Formulas in Cells
- Sparklines
- Keyboard Interaction
- Events from User Actions
- File Operations
- Storing Excel Summary and View
- Printing
- Chart Control
- Enhanced Chart
- Customizing Drawing
- Touch Support with the Component
- Spread Designer Guide
- Assembly Reference
- Import and Export Reference
- Version Comparison Reference
Combining different types of plots
Different types of series are compatible with each other and can be displayed in a single plot area, as long as the main classifications are the same series. For example, you can display bar and line series in the same Y plot area, as shown in the following image.
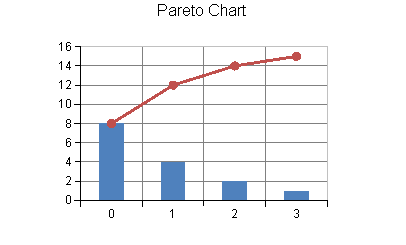
For more information on the API, see the YPlotArea class. Also, in the above image, the following classes are used to create bar and line series.
Represents the data series of a bar chart.
Represents the data series of a line chart.
Using the code
Create BarSeries and LineSeries objects to add data.
Create a YPlotArea object that represents the plot area and set its position and size.
Add the two data series you created to the plot area.
Create a label area.
Create a ChartModel object and add plot areas, labels, and legend areas.
Assign a chart model to the chart.
Example
The following example demonstrates how to display a bar series and a line series in the same plot area.
FarPoint.Win.Chart.BarSeries series0 = new FarPoint.Win.Chart.BarSeries();
series0.Values.Add(8.0);
series0.Values.Add(4.0);
series0.Values.Add(2.0);
series0.Values.Add(1.0);
FarPoint.Win.Chart.LineSeries series1 = new FarPoint.Win.Chart.LineSeries();
series1.PointMarker = new FarPoint.Win.Chart.BuiltinMarker(FarPoint.Win.Chart.MarkerShape.Circle, 7.0f);
series1.Values.Add(8.0);
series1.Values.Add(12.0);
series1.Values.Add(14.0);
series1.Values.Add(15.0);
FarPoint.Win.Chart.YPlotArea plotArea = new FarPoint.Win.Chart.YPlotArea();
plotArea.Location = new PointF(0.2f, 0.2f);
plotArea.Size = new SizeF(0.6f, 0.6f);
plotArea.Series.Add(series0);
plotArea.Series.Add(series1);
FarPoint.Win.Chart.LabelArea labelArea = new FarPoint.Win.Chart.LabelArea();
labelArea.Location = new PointF(0.5f, 0.02f);
labelArea.AlignmentX = 0.5f;
labelArea.AlignmentY = 0.0f;
labelArea.Text = "Pareto Chart";
FarPoint.Win.Chart.ChartModel model = new FarPoint.Win.Chart.ChartModel();
model.LabelAreas.Add(labelArea);
model.PlotAreas.Add(plotArea);
chart2DControl1.Model = model;
Dim series0 As New FarPoint.Win.Chart.BarSeries()
series0.Values.Add(8.0)
series0.Values.Add(4.0)
series0.Values.Add(2.0)
series0.Values.Add(1.0)
Dim series1 As New FarPoint.Win.Chart.LineSeries()
series1.PointMarker = New FarPoint.Win.Chart.BuiltinMarker(FarPoint.Win.Chart.MarkerShape.Circle, 7.0F)
series1.Values.Add(8.0)
series1.Values.Add(12.0)
series1.Values.Add(14.0)
series1.Values.Add(15.0)
Dim plotArea As New FarPoint.Win.Chart.YPlotArea()
plotArea.Location = New PointF(0.2F, 0.2F)
plotArea.Size = New SizeF(0.6F, 0.6F)
plotArea.Series.Add(series0)
plotArea.Series.Add(series1)
Dim labelArea As New FarPoint.Win.Chart.LabelArea()
labelArea.Location = New PointF(0.5F, 0.02F)
labelArea.AlignmentX = 0.5F
labelArea.AlignmentY = 0.0F
labelArea.Text = "Pareto Chart"
Dim model As New FarPoint.Win.Chart.ChartModel()
model.LabelAreas.Add(labelArea)
model.PlotAreas.Add(plotArea)
chart2DControl1.Model = model