
-
Spread Windows Forms Product Documentation
- Getting Started
-
Developer's Guide
- Understanding the Product
- Working with the Component
- Spreadsheet Objects
- Ribbon Control
- Sheets
- Rows and Columns
- Headers
- Cells
- Cell Types
- Data Binding
- Customizing the Sheet Appearance
- Customizing Interaction in Cells
- Tables
- Understanding the Underlying Models
- Customizing Row or Column Interaction
- Formulas in Cells
- Sparklines
- Keyboard Interaction
- Events from User Actions
- File Operations
- Storing Excel Summary and View
- Printing
- Chart Control
- Customizing Drawing
- Touch Support with the Component
- Spread Designer Guide
- Assembly Reference
- Import and Export Reference
- Version Comparison Reference
XYZ Surface Charts
The surface chart can be an XYZ plot such as the one shown in this figure.
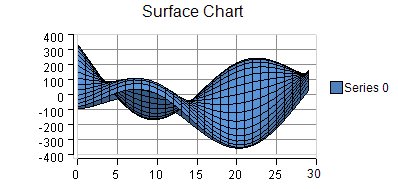
An XYZ surface series can be assigned a fill effect for the surface. Assigning null for the fill effect indicates that the property is unset.
Each point in a XYZ series has three data values: x, y, and z. Each point is visualized as a point on a surface.
For more information on the surface series object in the API, refer to the XYZSurfaceSeries class.