
-
Spread Windows Forms Product Documentation
- Getting Started
-
Developer's Guide
- Understanding the Product
- Working with the Component
- Spreadsheet Objects
- Ribbon Control
- Sheets
- Rows and Columns
- Headers
- Cells
- Cell Types
- Data Binding
- Customizing the Sheet Appearance
- Customizing Interaction in Cells
- Tables
- Pivot Table
- Understanding the Underlying Models
- Customizing Row or Column Interaction
- Formulas in Cells
- Sparklines
- Keyboard Interaction
- Events from User Actions
- File Operations
- Storing Excel Summary and View
- Printing
- Chart Control
- Enhanced Chart
- Customizing Drawing
- Touch Support with the Component
- Spread Designer Guide
- Assembly Reference
- Import and Export Reference
- Version Comparison Reference
Radar Plot Types
A radar plot area contains series that have values in one dimension. When visualized in two dimensions, a radar plot area takes the form of an n-sided polygon with a circular x-axis representing categories and a radial y-axis representing values. When visualized in three dimensions, a radar plot area takes the form of an n-sided disk with a circular x-axis representing categories and a radial y-axis representing values.
A radar series is displayed in a radar plot area. Each point has value(s) in one dimension: y (radius). If a plot area has multiple y-axes then a series can be assigned to a specific axis using the axis's ID. There are several subtypes of radar series: radar point, radar line, radar area, and radar stripe.
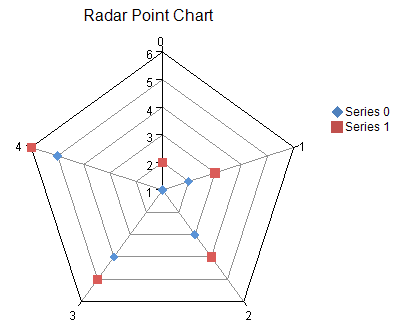
The figure below is an example of a radar chart.
You can have any of these types of Radar plots.
For details on the API, see the RadarPlotArea class.