
-
Spread Windows Forms Product Documentation
- Getting Started
-
Developer's Guide
- Understanding the Product
- Working with the Component
- Spreadsheet Objects
- Ribbon Control
- Sheets
- Rows and Columns
- Headers
- Cells
- Cell Types
- Data Binding
- Customizing the Sheet Appearance
- Customizing Interaction in Cells
- Tables
- Understanding the Underlying Models
- Customizing Row or Column Interaction
- Formulas in Cells
- Sparklines
- Keyboard Interaction
- Events from User Actions
- File Operations
- Storing Excel Summary and View
- Printing
- Chart Control
- Customizing Drawing
- Touch Support with the Component
- Spread Designer Guide
- Assembly Reference
- Import and Export Reference
- Version Comparison Reference
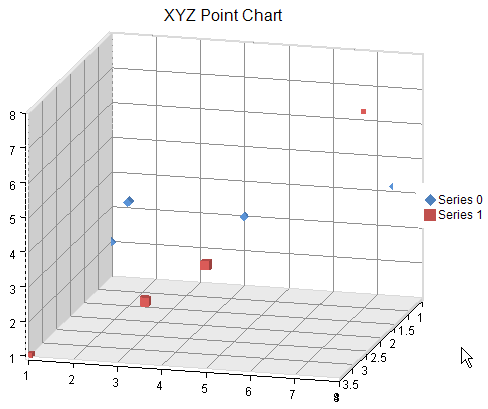
Creating an XYZ Plot
You can create an XYZ Plot chart using code or the designer. The following image shows an XYZPlot point type chart.
For details on the API, see the XYZPlotArea class.
The following classes are also available when creating XYZ plot type charts:
Pint Chart
Line Chart
XYZ Surface Series
!type=note
Note: To display a 3D chart, use the ViewType property of the SpreadChart class to set the chart display format.
Using Code
Create an XYZPointSeries object that represents the scatter plot (marker only) data series and add the data.
Create an XYZPlotArea object that represents the plot area and set its position and size.
Add a data series to the plot area.
Create labels and legend areas.
Create a ChartModel object and add plot areas, labels, and legend areas.
Assign a chart model to the chart.
Example
The following example demonstrates creating an XYZ scatter plot (markers only).
FarPoint.Win.Spread.Chart.SpreadChart chart3DControl1 = new FarPoint.Win.Spread.Chart.SpreadChart()
{
    Size =new Size(300,300),
    ViewType =FarPoint.Win.Chart.ChartViewType.View3D
};
FarPoint.Win.Chart.XYZPointSeries series0 = new FarPoint.Win.Chart.XYZPointSeries();
series0.SeriesName = "Series 0";
series0.XValues.Add(1.0);
series0.XValues.Add(2.0);
series0.XValues.Add(4.0);
series0.XValues.Add(8.0);
series0.YValues.Add(2.0);
series0.YValues.Add(4.0);
series0.YValues.Add(3.0);
series0.YValues.Add(5.0);
series0.ZValues.Add(1.0);
series0.ZValues.Add(2.0);
series0.ZValues.Add(1.0);
series0.ZValues.Add(2.0);
FarPoint.Win.Chart.XYZPointSeries series1 = new FarPoint.Win.Chart.XYZPointSeries();
series1.SeriesName = "Series 1";
series1.XValues.Add(1.0);
series1.XValues.Add(3.0);
series1.XValues.Add(5.0);
series1.XValues.Add(8.0);
series1.YValues.Add(1.0);
series1.YValues.Add(2.0);
series1.YValues.Add(4.0);
series1.YValues.Add(8.0);
series1.ZValues.Add(4.0);
series1.ZValues.Add(3.0);
series1.ZValues.Add(4.0);
series1.ZValues.Add(3.0);
FarPoint.Win.Chart.XYZPlotArea plotArea = new FarPoint.Win.Chart.XYZPlotArea();
plotArea.Location = new PointF(0.2f, 0.2f);
plotArea.Size = new SizeF(0.6f, 0.6f);
plotArea.Series.Add(series0);
plotArea.Series.Add(series1);
plotArea.Elevation = 10;
plotArea.Rotation = -20;
plotArea.ZAxes.Clear();
plotArea.ZAxes.Add(new FarPoint.Win.Chart.ValueAxis() { AutoMinimum = false, AutoMaximum = false, Minimum = 0, Maximum = 5 });
FarPoint.Win.Chart.LabelArea label = new FarPoint.Win.Chart.LabelArea();
label.Text = "XYZ Point Chart";
label.Location = new PointF(0.5f, 0.02f);
label.AlignmentX = 0.5f;
label.AlignmentY = 0.0f;
FarPoint.Win.Chart.LegendArea legend = new FarPoint.Win.Chart.LegendArea();
legend.Location = new PointF(0.98f, 0.5f);
legend.AlignmentX = 1.0f;
legend.AlignmentY = 0.5f;
FarPoint.Win.Chart.ChartModel model = new FarPoint.Win.Chart.ChartModel();
model.LabelAreas.Add(label);
model.LegendAreas.Add(legend);
model.PlotAreas.Add(plotArea);
chart3DControl1.Model = model;
Dim chart3DControl1 As New FarPoint.Win.Spread.Chart.SpreadChart() With {
.Size = New Size(300, 300),
.ViewType = FarPoint.Win.Chart.ChartViewType.View3D
}
Dim series0 As New FarPoint.Win.Chart.XYZPointSeries()
series0.SeriesName = "Series 0"
series0.XValues.Add(1.0)
series0.XValues.Add(2.0)
series0.XValues.Add(4.0)
series0.XValues.Add(8.0)
series0.YValues.Add(2.0)
series0.YValues.Add(4.0)
series0.YValues.Add(3.0)
series0.YValues.Add(5.0)
series0.ZValues.Add(1.0)
series0.ZValues.Add(2.0)
series0.ZValues.Add(1.0)
series0.ZValues.Add(2.0)
Dim series1 As New FarPoint.Win.Chart.XYZPointSeries()
series1.SeriesName = "Series 1"
series1.XValues.Add(1.0)
series1.XValues.Add(3.0)
series1.XValues.Add(5.0)
series1.XValues.Add(8.0)
series1.YValues.Add(1.0)
series1.YValues.Add(2.0)
series1.YValues.Add(4.0)
series1.YValues.Add(8.0)
series1.ZValues.Add(4.0)
series1.ZValues.Add(3.0)
series1.ZValues.Add(4.0)
series1.ZValues.Add(3.0)
Dim plotArea As New FarPoint.Win.Chart.XYZPlotArea()
plotArea.Location = New PointF(0.2F, 0.2F)
plotArea.Size = New SizeF(0.6F, 0.6F)
plotArea.Series.Add(series0)
plotArea.Series.Add(series1)
plotArea.Elevation = 10
plotArea.Rotation = -20
plotArea.ZAxes.Clear()
plotArea.ZAxes.Add(New FarPoint.Win.Chart.ValueAxis() With {
.AutoMinimum = False,
.AutoMaximum = False,
.Minimum = 0,
.Maximum = 5
})
Dim label As New FarPoint.Win.Chart.LabelArea()
label.Text = "XYZ Point Chart"
label.Location = New PointF(0.5F, 0.02F)
label.AlignmentX = 0.5F
label.AlignmentY = 0F
Dim legend As New FarPoint.Win.Chart.LegendArea()
legend.Location = New PointF(0.98F, 0.5F)
legend.AlignmentX = 1.0F
legend.AlignmentY = 0.5F
Dim model As New FarPoint.Win.Chart.ChartModel()
model.LabelAreas.Add(label)
model.LegendAreas.Add(legend)
model.PlotAreas.Add(plotArea)
chart3DControl1.Model = modelUsing the Chart designer
Run Chart Designer.
Select the target Chart Model from the tree menu on the left.
Open the Plot Area Collection Editor from PlotAreas in the Other section of the property list on the right.
Click the drop-down button to the right of the Add button.
Select and add the XYZPlotArea and set each property as required.
!type=note
Note: For information on starting Chart Designer, refer to Chart Designer in the SPREAD Designer Guide.