
-
Spread Windows Forms Product Documentation
- Getting Started
-
Developer's Guide
- Understanding the Product
- Working with the Component
- Spreadsheet Objects
- Ribbon Control
- Sheets
- Rows and Columns
- Headers
- Cells
- Cell Types
- Data Binding
- Customizing the Sheet Appearance
- Customizing Interaction in Cells
- Tables
- Understanding the Underlying Models
- Customizing Row or Column Interaction
- Formulas in Cells
- Sparklines
- Keyboard Interaction
- Events from User Actions
- File Operations
- Storing Excel Summary and View
- Printing
- Chart Control
- Customizing Drawing
- Touch Support with the Component
- Spread Designer Guide
- Assembly Reference
- Import and Export Reference
- Version Comparison Reference
XY Bubble Charts
The bubble chart can be an XY plot such as the one shown in this figure.
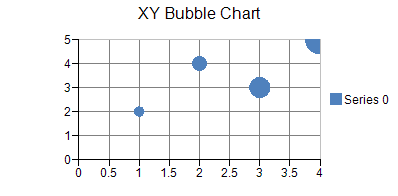
Each point contains two values: value and size.
Bubble borders and fill effects can be assigned for the series or for a point in the series. Null (Nothing in VB) indicates that the property is not set. Bubble size is measured relative to the plot area width (with a range of 0 to 1). Bubble depth is measured relative to the floor grid (with a range of 0 to 1).
For more information on the bubble series object in the API, refer to the XYBubbleSeries class.