
-
Spread Windows Forms Product Documentation
- Getting Started
-
Developer's Guide
- Understanding the Product
- Working with the Component
- Spreadsheet Objects
- Ribbon Control
- Sheets
- Rows and Columns
- Headers
- Cells
- Cell Types
- Data Binding
- Customizing the Sheet Appearance
- Customizing Interaction in Cells
- Tables
- Understanding the Underlying Models
- Customizing Row or Column Interaction
- Formulas in Cells
- Sparklines
- Keyboard Interaction
- Events from User Actions
- File Operations
- Storing Excel Summary and View
- Printing
- Chart Control
- Customizing Drawing
- Touch Support with the Component
- Spread Designer Guide
- Assembly Reference
- Import and Export Reference
- Version Comparison Reference
Radar Point Charts
The point markers in a radar point series or the series can be assigned a border, fill effect, shape, size, and a depth. Assigning null for a border or fill effect indicates that the property is unset. Size is measured in model units. Depth is measured relative to the plot area depth (0 = no depth, 1 = depth of plot area).
Each point has a single data value: y. Each point is visualized as a point marker. You can also specify individual point marker borders and fill effects for each data point.
The point chart can be a radar plot such as the one shown in this figure:
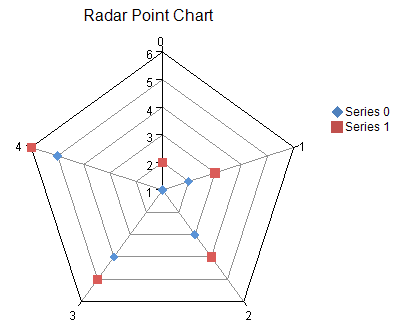
For more information on the point series object in the API, refer to the RadarPointSeries class.