
-
Spread Windows Forms Product Documentation
- Getting Started
-
Developer's Guide
- Understanding the Product
- Working with the Component
- Spreadsheet Objects
- Ribbon Control
- Sheets
- Rows and Columns
- Headers
- Cells
- Cell Types
- Data Binding
- Customizing the Sheet Appearance
- Customizing Interaction in Cells
- Tables
- Pivot Table
- Understanding the Underlying Models
- Customizing Row or Column Interaction
- Formulas in Cells
- Sparklines
- Keyboard Interaction
- Events from User Actions
- File Operations
- Storing Excel Summary and View
- Printing
- Chart Control
- Enhanced Chart
- Customizing Drawing
- Touch Support with the Component
- Spread Designer Guide
- Assembly Reference
- Import and Export Reference
- Version Comparison Reference
Customizing the Appearance of an Outline (Range Group)
You can customize the appearance of the outline (range group) using properties on the SheetView class or in an interface renderer.
The two properties in the SheetView class that can be used to customize the appearance are:
You can also use an EnhancedInterfaceRenderer to customize the appearance. The properties include:
The line color also sets the color of the points in the outline. The following figure shows the results of the example code below where several of these properties are set.
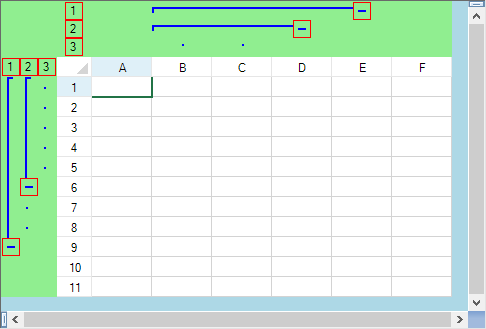
Notice that the outline background is different from the gray area of the spreadsheet.
Using Code
Create a new interface renderer to provide a custom look to outlines.
Set the RangeGroupBackgroundColor to specify the color.
Set the RangeGroupButtonBorderColor to specify the color for the button border.
Set the RangeGroupLineColor to specify the group line color.
Add the range groups with the AddRangeGroup method.
Example
This example creates an outline in the rows and in the columns and changes various colors. The result is shown in the preceding figure.
fpSpread1.ActiveSheet.Rows.Count = 11;
fpSpread1.ActiveSheet.Columns.Count = 6;
FarPoint.Win.Spread.EnhancedInterfaceRenderer outlinelook = new FarPoint.Win.Spread.EnhancedInterfaceRenderer();
outlinelook.RangeGroupBackgroundColor = Color.LightGreen;
outlinelook.RangeGroupButtonBorderColor = Color.Red;
outlinelook.RangeGroupLineColor = Color.Blue;
fpSpread1.InterfaceRenderer = outlinelook;
fpSpread1.ActiveSheet.AddRangeGroup(0, 8, true);
fpSpread1.ActiveSheet.AddRangeGroup(0, 5, true);
fpSpread1.ActiveSheet.AddRangeGroup(1, 3, false);
fpSpread1.ActiveSheet.AddRangeGroup(1, 2, false);
fpSpread1.ActiveSheet.Rows.Count = 11
fpSpread1.ActiveSheet.Columns.Count = 6
Dim outlinelook As New FarPoint.Win.Spread.EnhancedInterfaceRenderer
outlinelook.RangeGroupBackgroundColor = Color.LightGreen
outlinelook.RangeGroupButtonBorderColor = Color.Red
outlinelook.RangeGroupLineColor = Color.Blue
fpSpread1.InterfaceRenderer = outlinelook
fpSpread1.ActiveSheet.AddRangeGroup(0, 8, True)
fpSpread1.ActiveSheet.AddRangeGroup(0, 5, True)
fpSpread1.ActiveSheet.AddRangeGroup(1, 3, False)
fpSpread1.ActiveSheet.AddRangeGroup(1, 2, False)