
-
Spread Windows Forms Product Documentation
- Getting Started
-
Developer's Guide
- Understanding the Product
- Working with the Component
- Spreadsheet Objects
- Ribbon Control
- Sheets
- Rows and Columns
- Headers
- Cells
- Cell Types
- Data Binding
- Customizing the Sheet Appearance
- Customizing Interaction in Cells
- Tables
- Pivot Table
- Understanding the Underlying Models
- Customizing Row or Column Interaction
- Formulas in Cells
-
Sparklines
- Add Sparklines Using Methods
-
Add Sparklines using Formulas
- Column, Line, and Winloss Sparkline
- Area Sparkline
- BoxPlot Sparkline
- Bullet Sparkline
- Cascade Sparkline
- Gauge KPI Sparkline
- Hbar and Vbar Sparkline
- Histogram Sparkline
- Image Sparkline
- Month and Year Sparkline
- Pareto Sparkline
- Pie Sparkline
- Scatter Sparkline
- Spread Sparkline
- Stacked Sparkline
- Vari Sparkline
- Keyboard Interaction
- Events from User Actions
- File Operations
- Storing Excel Summary and View
- Printing
- Chart Control
- Enhanced Chart
- Customizing Drawing
- Touch Support with the Component
- Spread Designer Guide
- Assembly Reference
- Import and Export Reference
- Version Comparison Reference
Cascade Sparkline
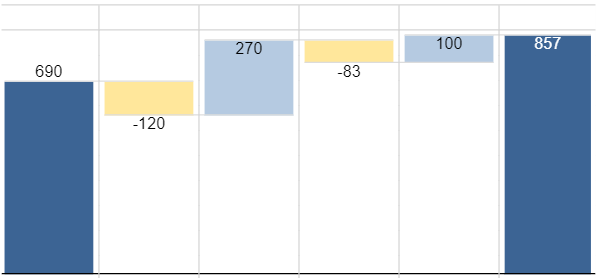
A cascade sparkline is generally used to analyze a value over time and shows the progressive changes between two values like yearly sales, total profit, net tax etc. It is used widely in finance, sales, legal and construction sectors, to name a few.
The cascade sparkline formula is used with following parameters:
=CASCADESPARKLINE(pointsRange, [pointIndex, labelsRange, minimum, maximum, colorPositive, colorNegative, vertical, itemTypeRange, colorTotal, colorTransition])
The formula options are described below:
Option | Description |
|---|---|
pointsRange | A reference that represents the range of cells that contains values, such as "B2:B8". |
pointIndex Optional | A number or reference that represents the points index. The pointIndex is >= 1 such as 1 or "D2". |
labelsRange Optional | A reference that represents the range of cells that contains the labels, such as "A2:A8". The default value is no label. |
minimum Optional | A number or reference that represents the minimum values of the display area. The default value is the minimum of the sum (the sum of the points' value), such as -2000. The minimum set must be less than the default minimum; otherwise, the default minimum is used. |
maximum Optional | A number or reference that represents the maximum values of the display area. The default value is the maximum of the sum (the sum of the points' value), such as 6000. The maximum set must be greater than the default maximum; otherwise, the default maximum is used. |
colorPositive Optional | A string that represents the color of the first or last positive sparkline's box (this point's value is positive). The default value is "#8CBF64". If the first or last box represents a positive value, the box's color is set to colorPositive. The middle positive box is set to a lighter color than colorPositive. |
colorNegative Optional | A string that represents the color of the first or last negative sparkline's box (this point's value is negative). The default value is "#D6604D". If the first or last box represents the negative value, the box's color is set to colorNegative. The middle negative box is set to a lighter color than colorNegative. |
vertical Optional | A boolean that represents whether the box's direction is vertical or horizontal. The default value is FALSE. You must set vertical to true or false for a group of formulas, because all the formulas represent the entire sparkline. |
itemTypeRange Optional | An array or reference that represents all the item types of the data range. The values should be {"-", "+", "="} or "A1:A7" that reference the value of {"+", "-", "="}, where "+" indicates positive change, "-" indicates negative change and "=" indicates total columns. |
colorTotal Optional | A string that either represents the color of the last sparkline's box when itemTypeRange does not exist or represents the color of the resulting sparkline's box when itemTypeRange exists. This setting is optional. |
colorTransition Optional | Indicates the color transition of middle items. The value is in range of -1 to 1. The default value is 0.5 |
Usage Scenario
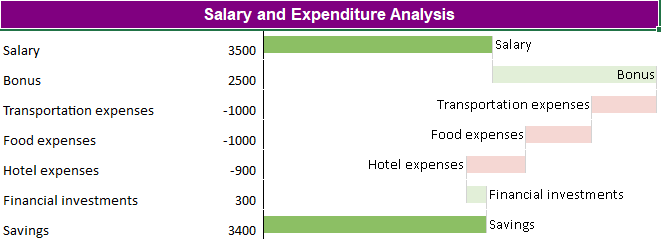
Consider a scenario where a salesperson wants to analyze their monthly salary and expenditure costs. A Cascade sparkline can depict how their finances go through progressive changes in a month.
// Get sheet
var worksheet = fpSpread1_Sheet1.AsWorksheet();

// Set data for sparkline
worksheet.SetValue(1, 0, "Salary");
worksheet.SetValue(2, 0, "Bonus");
worksheet.SetValue(3, 0, "Transportation expenses");
worksheet.SetValue(4, 0, "Food expenses");
worksheet.SetValue(5, 0, "Hotel expenses");
worksheet.SetValue(6, 0, "Financial investments");
worksheet.SetValue(7, 0, "Savings");
worksheet.SetValue(1, 1, 3500);
worksheet.SetValue(2, 1, 2500);
worksheet.SetValue(3, 1, -1000);
worksheet.SetValue(4, 1, -1000);
worksheet.SetValue(5, 1, -900);
worksheet.SetValue(6, 1, 300);
worksheet.Cells[7, 1].Formula = "Sum(B2:B7)";

// Add formula for cascadesparkline
worksheet.Cells[1, 2].Formula2 = "CASCADESPARKLINE(B2:B8,,A2:A8,,,\"#8CBF64\",\"#D6604D\",false)";

// Set backcolor and forecolor for cells
worksheet.Cells["A1"].Interior.Color = GrapeCity.Spreadsheet.Color.FromArgb(unchecked((int)0xFF800080));
fpSpread1_Sheet1.Cells["A1"].ForeColor = Color.FromArgb(unchecked((int)0xFFFFFFFF));
'Get sheet
Dim worksheet = FpSpread1.ActiveSheet.AsWorksheet()
'Set data for sparkline
worksheet.SetValue(1, 0, "Salary")
worksheet.SetValue(2, 0, "Bonus")
worksheet.SetValue(3, 0, "Transportation expenses")
worksheet.SetValue(4, 0, "Food expenses")
worksheet.SetValue(5, 0, "Hotel expenses")
worksheet.SetValue(6, 0, "Financial investments")
worksheet.SetValue(7, 0, "Savings")
worksheet.SetValue(1, 1, 3500)
worksheet.SetValue(2, 1, 2500)
worksheet.SetValue(3, 1, -1000)
worksheet.SetValue(4, 1, -1000)
worksheet.SetValue(5, 1, -900)
worksheet.SetValue(6, 1, 300)
worksheet.Cells(7, 1).Formula = "Sum(B2:B7)"
'Add formula for cascadesparkline
worksheet.Cells(1, 2).Formula2 = "CASCADESPARKLINE(B2:B8,,A2:A8,,,""#8CBF64"",""#D6604D"",false)"
'Set backcolor and forecolor for cells
worksheet.Cells("A1").Interior.Color = GrapeCity.Spreadsheet.Color.FromArgb(&HFF800080)
FpSpread1_Sheet1.Cells("A1").ForeColor = Color.FromArgb(&HFFFFFFFF)Using the Spread Designer
Type data in a cell or a column or row of cells in the designer.
Select a cell for the sparkline.
Select the Insert menu.
Select a sparkline type.
Set the Data Range in the Create Sparklines dialog (such as =Sheet1!$E$1:$E$3).
Alternatively, set the range by selecting the cells in the range using the pointer.
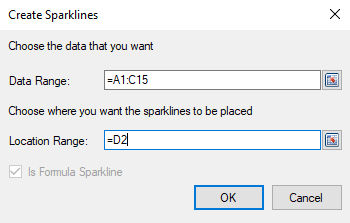
You can also set additional sparkline settings in the dialog if available.
Select OK.
Select Apply and Exit from the File menu to save your changes and close the designer.