
-
Spread Windows Forms Product Documentation
- Getting Started
-
Developer's Guide
- Understanding the Product
- Working with the Component
- Spreadsheet Objects
- Ribbon Control
- Sheets
- Rows and Columns
- Headers
- Cells
- Cell Types
- Data Binding
- Customizing the Sheet Appearance
- Customizing Interaction in Cells
- Tables
- Pivot Table
- Understanding the Underlying Models
- Customizing Row or Column Interaction
- Formulas in Cells
-
Sparklines
- Add Sparklines Using Methods
-
Add Sparklines using Formulas
- Column, Line, and Winloss Sparkline
- Area Sparkline
- BoxPlot Sparkline
- Bullet Sparkline
- Cascade Sparkline
- Gauge KPI Sparkline
- Hbar and Vbar Sparkline
- Histogram Sparkline
- Image Sparkline
- Month and Year Sparkline
- Pareto Sparkline
- Pie Sparkline
- Scatter Sparkline
- Spread Sparkline
- Stacked Sparkline
- Vari Sparkline
- Keyboard Interaction
- Events from User Actions
- File Operations
- Storing Excel Summary and View
- Printing
- Chart Control
- Enhanced Chart
- Customizing Drawing
- Touch Support with the Component
- Spread Designer Guide
- Assembly Reference
- Import and Export Reference
- Version Comparison Reference
Histogram Sparkline
Histograms are used to represent the frequency distribution of a data set. Spread for Winforms allows you to create histogram sparklines by using the histogram sparkline function.
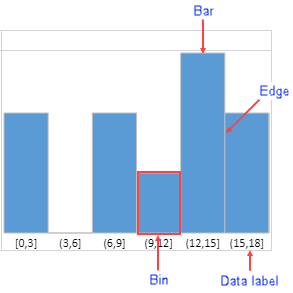
The above image shows a histogram sparkline and its elements:
Bin: The data container which contains data of the specified range of values.
Bar: The paint block responsible for UI. The bar height is determined by the following expression if the paintLabel option is true:
(cellRowHeight - labelFontSize - 6px)Otherwise it is determined by:
(cellRowHeight - 6px)Edge: The border of bar.
Data Label: The data range displayed in the sparkline. The data label font size is determined by the expression:
Math.floor(cellRowHeight/3)If the font size is more than the expression, then the largest integer less than or equal to the expression is taken as the font size.
If the height of the cell is less than cell row height, the font size is 12px.
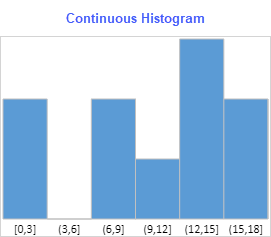
Types of Histogram Sparklines
The Histogram sparklines can be displayed in a discrete or continuous manner as shown below:
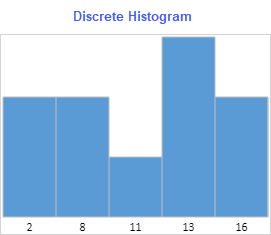
Discrete Histogram represents the data in a discrete manner (without continuous intervals) by taking existing values. For example: 20, 34, 38. The values are painted in ascending order.
Continuous Histogram represents the data by taking a range of continuous values. The intervals for the first bin are left-closed and right-closed, whereas intervals for rest of the bins are left-open and right-closed.
The lower bound is calculated using:
Math.floor(minValue/scale)*scaleWhereas the upper bound is calculated using:
Math.ceil(maxValue/scale)*scaleThe width of bin is 1, by default
If the scale is lower than 0, the sparkline is set to 1
The type of histogram can be specified by using the continuous option in the HistogramSparkline formula.
The histogram sparkline formula has the following syntax:
=HISTOGRAMSPARKLINE(dataRange, [continuous, paintLabel, scale, barWidth, barColor, labelFontStyle, labelColor, edgeColor])
The formula options are described below:
Option | Description |
|---|---|
dataRange | Specifies the range of data sources. It supports a range. It supports calc array and calc reference. |
continuous Optional | If set to true, the sparkline is a continuous histogram. If set to false, the sparkline is a discrete histogram. The default value is true. |
paintLabel Optional | If set to true, the sparkline paints the data label. The default value is false. |
scale Optional | Specifies the bin width. This value is useful when histogram type is continuous. The default value is false. |
barWidth Optional | Specifies the bar width. Default value is 1. Bar width = auto calc width * barWidth Value range is 0 < value ≤ 1. |
barColor Optional | Specifies the color of the bar. Default value is '5B9BD5'. Supports CSS color property. |
labelFontStyle Optional | Specifies the font style of the data label font. The default value is 9pt Calibri. Supports CSS font property. It supports font-style, font-weight, font-size, font-family. |
labelColor Optional | Specifies the font color of data label font. Default is black (#00000). Supports CSS color string. |
edgeColor Optional | Specifies the color of the edge. Default value is silver (#C0C0C0). Supports CSS color property. |
type=note
Notes:
The default padding of sparkline is 3px.
The paintLabel option does not paint the data label when the custom font size is more than one-third of cell row height.
The data label does not paint when any of the data label's width is bigger than the bar's average width. The average width is determined by the expression (cell width/bar count).
For example, for 100px cell width, there are 5 bars in the sparkline. The bar average width is 20px. In this sparkline, if any data label is wider than 20px, the data label does not paint.
In the data range, any non-number type value is ignored.
Usage Scenario
Consider a scenario where an organization has conducted a survey of social media consumption by users on a weekly basis. The histogram sparkline can depict these statistics and analyze the trends about how much time users spent on different social media platforms.
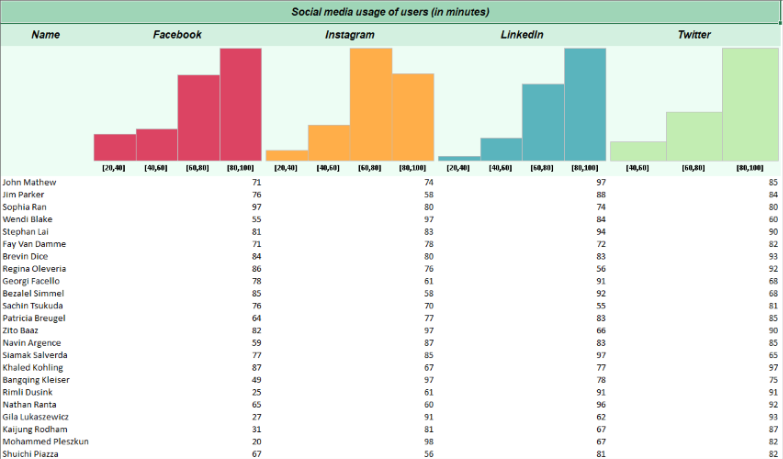
Histogram Sparkline Usage Scenario
// Get sheet
var worksheet = fpSpread1.Sheets[0].AsWorksheet();

// Set data for histogram sparkline
worksheet.SetValue(1, 0, new object[,]
{
    { "Name", "Facebook", "Instagram", "LinkedIn", "Twitter" }
});

worksheet.SetValue(3, 0, new object[,]
{
        {"John Mathew", 71, 74, 97, 85},
        {"Jim Parker", 76, 58, 88, 84},
        {"Sophia Ran", 97, 80, 74, 80},
        {"Wendi Blake", 55, 97, 84, 60},
        {"Stephan Lai", 81, 83, 94, 90},
        {"Fay Van Damme", 71, 78, 72, 82},
        {"Brevin Dice", 84, 80, 83, 93},
        {"Regina Oleveria", 86, 76, 56, 92},
        {"Georgi Facello", 78, 61, 91, 68},
        {"Bezalel Simmel", 85, 58, 92, 68},
        {"Sachin Tsukuda", 76, 70, 55, 81},
        {"Patricia Breugel", 64, 77, 83, 85},
        {"Zito Baaz", 82, 97, 66, 90},
        {"Navin Argence", 59, 87, 83, 85},
        {"Siamak Salverda", 77, 85, 97, 65},
        {"Khaled Kohling", 87, 67, 77, 97},
        {"Bangqing Kleiser", 49, 97, 78, 75},
        {"Rimli Dusink", 25, 61, 91, 91},
        {"Nathan Ranta", 65, 60, 96, 92},
        {"Gila Lukaszewicz", 27, 91, 62, 93},
        {"Kaijung Rodham", 31, 81, 67, 87},
        {"Mohammed Pleszkun", 20, 98, 67, 82},
        {"Shuichi Piazza", 67, 56, 81, 82},
        {"Katsuo Leuchs", 83, 74, 51, 42},
        {"Masanao Ducloy", 67, 64, 58, 73},
        {"Mihalis Crabtree", 80, 91, 57, 84},
        {"Danny Lenart", 92, 38, 99, 86},
        {"Yongqiao Dalton", 85, 61, 73, 81},
        {"Gaetan Veldwijk", 64, 52, 76, 72},
        {"Leszek Pulkowski", 95, 75, 64, 99},
        {"Weidon Gente", 77, 88, 77, 96},
        {"Krister Stranks", 72, 38, 89, 55},
        {"Ziyad Baaz", 89, 81, 83, 48},
        {"Ymte Perelgut", 67, 70, 97, 94},
        {"Tonia Butner", 99, 71, 87, 76},
        {"Shigeaki Narlikar", 78, 80, 80, 97},
        {"Ayakannu Beerel", 86, 61, 85, 81},
        {"Moni Bale", 60, 72, 71, 86},
        {"Manohar Heemskerk", 97, 60, 75, 78},
        {"Angus Swan", 33, 97, 99, 99},
        {"Christ Murtagh", 91, 76, 73, 80},
        {"Maren Baez", 45, 77, 86, 88},
        {"Greger Jahnichen", 98, 89, 81, 63},
        {"Ymte Duclos", 95, 83, 72, 72},
        {"Chenyi Hainaut", 81, 97, 99, 87},
        {"Kasidit Picel", 87, 80, 88, 80},
        {"Elrique Walstra", 96, 54, 38, 54},
        {"Adel Reghbati", 56, 88, 81, 88}
 });

// Set HistogramSparkline formulas
worksheet.Cells[2, 1].Formula = "HISTOGRAMSPARKLINE(Sheet1!B4: B51, true, true, 20, 1,\"#DC4463\", \"bold normal 10pt Calibri\", \"black\")";
worksheet.Cells[2, 2].Formula = "HISTOGRAMSPARKLINE(Sheet1!C4: C51, true, true, 20, 1, \"#FFAE49\", \"bold normal 10pt Calibri\", \"black\")";
worksheet.Cells[2, 3].Formula = "HISTOGRAMSPARKLINE(Sheet1!D4: D51, true, true, 20, 1, \"#5AB4BD\", \"bold normal 10pt Calibri\", \"black\")";
worksheet.Cells[2, 4].Formula = "HISTOGRAMSPARKLINE(Sheet1!E4: E51, true, true, 20, 1, \"#C2EDB2\", \"bold normal 10pt Calibri\", \"black\")";
'Get sheet
Dim worksheet = FpSpread1.Sheets(0).AsWorksheet()
'Set data for histogram sparkline
worksheet.SetValue(1, 0, New Object(,) {
{"Name", "Facebook", "Instagram", "LinkedIn", "Twitter"}
})
worksheet.SetValue(3, 0, New Object(,) {
{"John Mathew", 71, 74, 97, 85},
{"Jim Parker", 76, 58, 88, 84},
{"Sophia Ran", 97, 80, 74, 80},
{"Wendi Blake", 55, 97, 84, 60},
{"Stephan Lai", 81, 83, 94, 90},
{"Fay Van Damme", 71, 78, 72, 82},
{"Brevin Dice", 84, 80, 83, 93},
{"Regina Oleveria", 86, 76, 56, 92},
{"Georgi Facello", 78, 61, 91, 68},
{"Bezalel Simmel", 85, 58, 92, 68},
{"Sachin Tsukuda", 76, 70, 55, 81},
{"Patricia Breugel", 64, 77, 83, 85},
{"Zito Baaz", 82, 97, 66, 90},
{"Navin Argence", 59, 87, 83, 85},
{"Siamak Salverda", 77, 85, 97, 65},
{"Khaled Kohling", 87, 67, 77, 97},
{"Bangqing Kleiser", 49, 97, 78, 75},
{"Rimli Dusink", 25, 61, 91, 91},
{"Nathan Ranta", 65, 60, 96, 92},
{"Gila Lukaszewicz", 27, 91, 62, 93},
{"Kaijung Rodham", 31, 81, 67, 87},
{"Mohammed Pleszkun", 20, 98, 67, 82},
{"Shuichi Piazza", 67, 56, 81, 82},
{"Katsuo Leuchs", 83, 74, 51, 42},
{"Masanao Ducloy", 67, 64, 58, 73},
{"Mihalis Crabtree", 80, 91, 57, 84},
{"Danny Lenart", 92, 38, 99, 86},
{"Yongqiao Dalton", 85, 61, 73, 81},
{"Gaetan Veldwijk", 64, 52, 76, 72},
{"Leszek Pulkowski", 95, 75, 64, 99},
{"Weidon Gente", 77, 88, 77, 96},
{"Krister Stranks", 72, 38, 89, 55},
{"Ziyad Baaz", 89, 81, 83, 48},
{"Ymte Perelgut", 67, 70, 97, 94},
{"Tonia Butner", 99, 71, 87, 76},
{"Shigeaki Narlikar", 78, 80, 80, 97},
{"Ayakannu Beerel", 86, 61, 85, 81},
{"Moni Bale", 60, 72, 71, 86},
{"Manohar Heemskerk", 97, 60, 75, 78},
{"Angus Swan", 33, 97, 99, 99},
{"Christ Murtagh", 91, 76, 73, 80},
{"Maren Baez", 45, 77, 86, 88},
{"Greger Jahnichen", 98, 89, 81, 63},
{"Ymte Duclos", 95, 83, 72, 72},
{"Chenyi Hainaut", 81, 97, 99, 87},
{"Kasidit Picel", 87, 80, 88, 80},
{"Elrique Walstra", 96, 54, 38, 54},
{"Adel Reghbati", 56, 88, 81, 88}
})
'Set HistogramSparkline formulas
worksheet.Cells(2, 1).Formula = "HISTOGRAMSPARKLINE(Sheet1!B4: B51, true, true, 20, 1,""#DC4463"", ""bold normal 10pt Calibri"", ""black"")"
worksheet.Cells(2, 2).Formula = "HISTOGRAMSPARKLINE(Sheet1!C4: C51, true, true, 20, 1, ""#FFAE49"", ""bold normal 10pt Calibri"", ""black"")"
worksheet.Cells(2, 3).Formula = "HISTOGRAMSPARKLINE(Sheet1!D4: D51, true, true, 20, 1, ""#5AB4BD"", ""bold normal 10pt Calibri"", ""black"")"
worksheet.Cells(2, 4).Formula = "HISTOGRAMSPARKLINE(Sheet1!E4: E51, true, true, 20, 1, ""#C2EDB2"", ""bold normal 10pt Calibri"", ""black"")"Using the Spread Designer
Type data in a cell or a column or row of cells in the designer.
Select a cell for the sparkline.
Select the Insert menu.
Select a sparkline type.
Set the Data Range in the Create Sparklines dialog (such as =Sheet1!$E$1:$E$3).
Alternatively, set the range by selecting the cells in the range using the pointer.
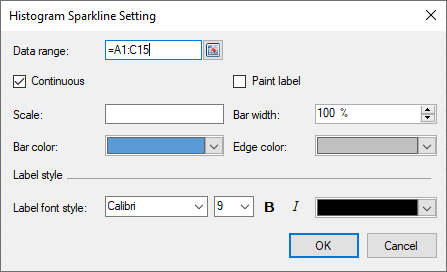
You can also set additional sparkline settings in the dialog if available.
Select OK.
Select Apply and Exit from the File menu to save your changes and close the designer.