


-
Spread Windows Forms Product Documentation
- Getting Started
-
Developer's Guide
- Understanding the Product
- Working with the Component
- Spreadsheet Objects
- Ribbon Control
- Sheets
- Rows and Columns
- Headers
- Cells
- Cell Types
- Data Binding
- Customizing the Sheet Appearance
- Customizing Interaction in Cells
- Tables
- Pivot Table
- Understanding the Underlying Models
- Customizing Row or Column Interaction
- Formulas in Cells
-
Sparklines
- Add Sparklines Using Methods
-
Add Sparklines using Formulas
- Column, Line, and Winloss Sparkline
- Area Sparkline
- BoxPlot Sparkline
- Bullet Sparkline
- Cascade Sparkline
- Gauge KPI Sparkline
- Hbar and Vbar Sparkline
- Histogram Sparkline
- Image Sparkline
- Month and Year Sparkline
- Pareto Sparkline
- Pie Sparkline
- Scatter Sparkline
- Spread Sparkline
- Stacked Sparkline
- Vari Sparkline
- Keyboard Interaction
- Events from User Actions
- File Operations
- Storing Excel Summary and View
- Printing
- Chart Control
- Enhanced Chart
- Customizing Drawing
- Touch Support with the Component
- Spread Designer Guide
- Assembly Reference
- Import and Export Reference
- Version Comparison Reference
Month and Year Sparkline
Month and year sparklines are used for spotting monthly and annual trends in a given set of data. You can showcase the difference in data sets using a color range.
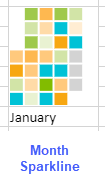
A month sparkline has 6x7 square spaces where a week of the month is displayed in horizontal direction from left to right and the days of the week (from Sunday to Saturday) are displayed in vertical direction from top to bottom. There are white separator lines among days.
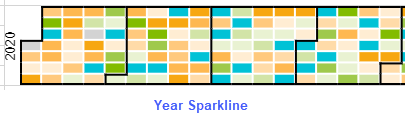
A year sparkline has 54x7 square spaces where the weeks of year is displayed in horizontal direction from left to right and The days of the week (from Sunday to Saturday) are displayed in vertical direction from top to bottom.
There are white separator lines among days and black separator lines among months.
The month sparkline formula has the following formats:
=MONTHSPARKLINE(year, month, dataRange, emptyColor, startColor, middleColor, endColor)
or
=MONTHSPARKLINE(year, month, dataRange, colorRange)
The year sparkline formula has the following formats:
=YEARSPARKLINE(year, dataRange, emptyColor, startColor, middleColor, endColor)
or
=YEARSPARKLINE(year, dataRange, colorRange)
The formula options are described below:
Option | Description |
|---|---|
year | A full year number, such as 2017. |
month | A month number, such as 3. The month is 1-based (Jan = 1). This option is specific to MONTHSPARKLINE |
dataRange | A reference that represents a range where the first column is a date and the second column is a number, such as "A1:B400". |
emptyColor | A color string that represents days with no value or zero value, such as "lightgray". |
startColor | A color string that represents the minimum day value, such as "lightgreen". |
middleColor | A color string that represents the day with the average minimum and maximum value, such as "green". |
endColor | A color string that represents the day with the maximum value, such as "darkgreen". |
colorRange | A reference that represents a range where the data is a color string. |
Usage Scenario
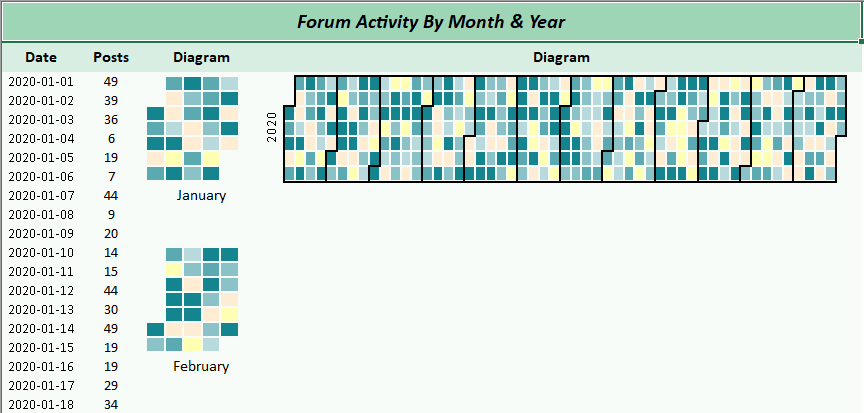
Consider a scenario where a company receives several query posts in its support forum all around the year. A month and year sparkline are convenient to observe the forum section activity. They can help identify the days with the most and least amount of site traffic in a specific month or a year.
// Get sheet
var worksheet = fpSpread1_Sheet1.AsWorksheet();

// Set data
DateTime dates = new DateTime(2020, 1, 1);

// Initialize Random number
Random _rand = new Random();

for (var row = 3; row <= worksheet.RowCount; row++)
{
    worksheet.Cells[$"A{row}"].Value = dates.AddDays(row - 3);
    worksheet.Cells[$"B{row}"].Value = Math.Round(_rand.NextDouble() * 50);
    worksheet.Cells[$"C{row}"].Value = colorList[_rand.Next(0, colorList.Length)];
}

// Set month sparkline formula
worksheet.Cells["D3"].Formula2 = "MONTHSPARKLINE(2020,1,A3:B33,C3:C33)";
worksheet.Cells["D9"].Formula2 = "TEXT(DATE(2020,1, 1),\"mmmm\")";
worksheet.Cells["D12"].Formula2 = "MONTHSPARKLINE(2020,2,A34:B62,C34:C62)";
worksheet.Cells["D18"].Formula2 = "TEXT(DATE(2020,2, 1),\"mmmm\")";

// Set year sparkline formula
worksheet.Cells["E3"].Formula2 = $"YearSparkline(2020, A3:B{worksheet.RowCount}, C3:C368)";
'Get sheet
Dim worksheet = FpSpread1_Sheet1.AsWorksheet()
'Initialize random number
Dim _rand As New Random()
'Set data
Dim dates As New DateTime(2020, 1, 1)
For row = 3 To worksheet.RowCount
worksheet.Cells($"A{row}").Value = dates.AddDays(row - 3)
worksheet.Cells($"B{row}").Value = Math.Round(_rand.NextDouble() * 50)
worksheet.Cells($"C{row}").Value = colorList(_rand.[Next](0, colorList.Length))
Next
'Set month sparkline formula
worksheet.Cells("D3").Formula2 = "MONTHSPARKLINE(2020,1,A3:B33,C3:C33)"
worksheet.Cells("D9").Formula2 = "TEXT(DATE(2020,1, 1),""mmmm"")"
worksheet.Cells("D12").Formula2 = "MONTHSPARKLINE(2020,2,A34:B62,C34:C62)"
worksheet.Cells("D18").Formula2 = "TEXT(DATE(2020,2, 1),""mmmm"")"
'Set year sparkline formula
worksheet.Cells("E3").Formula2 = $"YearSparkline(2020, A3:B{worksheet.RowCount}, C3:C368)"Using the Spread Designer
Type the Data Range in cells where the first column is a date and the second column is a number.
Select a cell for the sparkline.
Select the Insert menu.
Select a sparkline type.
Set the Data Range in the Sparkline Dialog (such as =Sheet1!$E$1:$E$3).
Alternatively, set the range by selecting the cells in the range using the pointer.
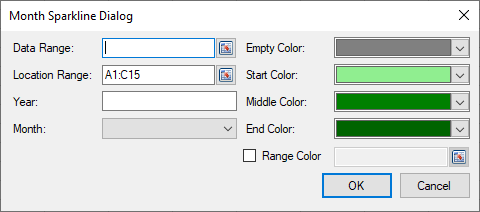
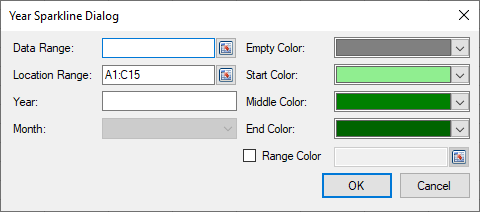
Set the additional sparkline settings as shown in the images above.
Select OK.
Select Apply and Exit from the File menu to save your changes and close the designer.