


-
Spread Windows Forms Product Documentation
- Getting Started
-
Developer's Guide
- Understanding the Product
- Working with the Component
- Spreadsheet Objects
- Ribbon Control
- Sheets
- Rows and Columns
- Headers
- Cells
- Cell Types
- Data Binding
- Customizing the Sheet Appearance
- Customizing Interaction in Cells
- Tables
- Pivot Table
- Understanding the Underlying Models
- Customizing Row or Column Interaction
- Formulas in Cells
-
Sparklines
- Add Sparklines Using Methods
-
Add Sparklines using Formulas
- Column, Line, and Winloss Sparkline
- Area Sparkline
- BoxPlot Sparkline
- Bullet Sparkline
- Cascade Sparkline
- Gauge KPI Sparkline
- Hbar and Vbar Sparkline
- Histogram Sparkline
- Image Sparkline
- Month and Year Sparkline
- Pareto Sparkline
- Pie Sparkline
- Scatter Sparkline
- Spread Sparkline
- Stacked Sparkline
- Vari Sparkline
- Keyboard Interaction
- Events from User Actions
- File Operations
- Storing Excel Summary and View
- Printing
- Chart Control
- Enhanced Chart
- Customizing Drawing
- Touch Support with the Component
- Spread Designer Guide
- Assembly Reference
- Import and Export Reference
- Version Comparison Reference
Add Sparklines using Formulas
You can add different types of sparklines using their respective formulas in Spread for Winforms. The following table showcases the different sparklines available:
Types of Sparklines | |||
|---|---|---|---|
|
|
|
|
| [ |
|
|
|
|
|
|
|
|
|
|
|
|
|
|
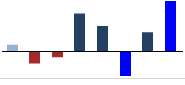 Column Sparkline
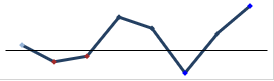 Line Sparkline
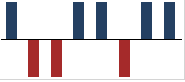 Winloss Sparkline
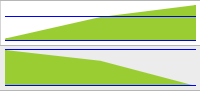 Area Sparkline
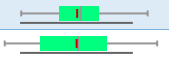 Box Plot Sparkline
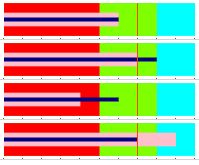 Bullet Sparkline
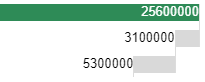 Cascade Sparkline
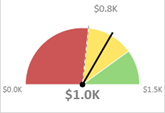 Gauge KPI Sparkline
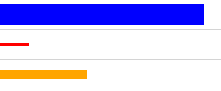 Hbar Sparkline
 Vbar Sparkline
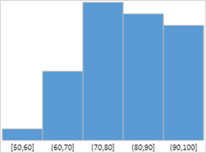 Histogram Sparkline
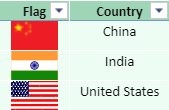 Image Sparkline
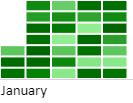 Month Sparkline
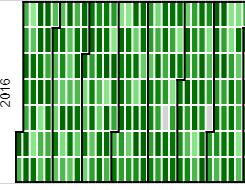 Year Sparkline
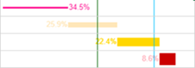 Pareto Sparkline
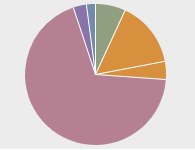 Pie Sparkline
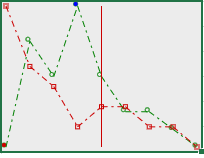 Scatter Sparkline
 Spread Sparkline
 Stacked Sparkline
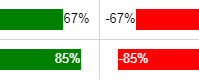 Vari Sparkline
!type=note
Note: The GrapeCity.Spreadsheet.DataVisualization.dll file is required to use the above sparkline functions. Users must add the DLL file in the project manually.