
-
Spread Windows Forms 18 Product Documentation
- Getting Started
-
Developer's Guide
- Understanding the Product
- Working with the Component
- Spreadsheet Objects
- Ribbon Control
- Sheets
- Rows and Columns
- Headers
- Cells
- Cell Types
- Data Binding
- Customizing the Sheet Appearance
- Customizing Interaction in Cells
- Tables
- Understanding the Underlying Models
- Customizing Row or Column Interaction
- Formulas in Cells
- Sparklines
- Keyboard Interaction
- Events from User Actions
- File Operations
- Storing Excel Summary and View
- Printing
- Chart Control
- Customizing Drawing
- Touch Support with the Component
- Spread Designer Guide
- Assembly Reference
- Import and Export Reference
- Version Comparison Reference
Walls
A wall is the area (or plane) behind, below, or to the side of a chart.
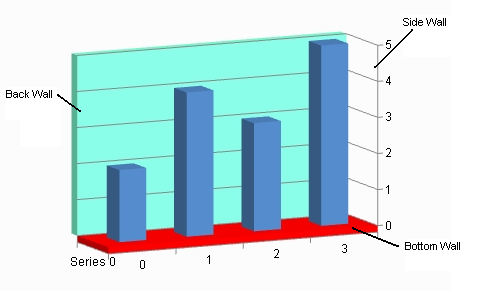
A wall can have a border, fill effect, or width (measured in model units). The wall can be visible or hidden. The axis grids (major and minor) and stripes are painted on the walls. The axis grid lines (major and minor) are painted over the axis stripes.
See the following for more information on how to set properties for walls:
Example
The following example shows the back of the plot area and fills it with a solid color.
FarPoint.Win.Chart.YPlotArea plotArea = new FarPoint.Win.Chart.YPlotArea();
plotArea.BackWall.Visible = true;
plotArea.BackWall.Fill = new FarPoint.Win.Chart.SolidFill(Color.Aquamarine);
Dim plotArea As New FarPoint.Win.Chart.YPlotArea()
plotArea.BackWall.Visible = True
plotArea.BackWall.Fill = New FarPoint.Win.Chart.SolidFill(Color.Aquamarine)Using a Chart designer
Run the Chart Designer.
Select the target Plot Area from the tree menu on the left.
From the Other section of the property list on the right, expand the BackWall tree and set its properties.
Click OK and close the Chart Designer.
!type=note
Note: For information on starting Chart Designer, refer to Chart Designer in the SPREAD Designer Guide.