
-
Spread Windows Forms Product Documentation
- Getting Started
-
Developer's Guide
- Understanding the Product
- Working with the Component
- Spreadsheet Objects
- Ribbon Control
- Sheets
- Rows and Columns
- Headers
- Cells
- Cell Types
- Data Binding
- Customizing the Sheet Appearance
- Customizing Interaction in Cells
- Tables
- Pivot Table
- Understanding the Underlying Models
- Customizing Row or Column Interaction
- Formulas in Cells
- Sparklines
- Keyboard Interaction
- Events from User Actions
- File Operations
- Storing Excel Summary and View
- Printing
- Chart Control
- Enhanced Chart
- Customizing Drawing
- Touch Support with the Component
- Spread Designer Guide
- Assembly Reference
- Import and Export Reference
- Version Comparison Reference
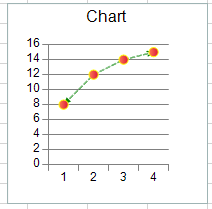
Chart Line Style
You can create a line style with special options such as open and end arrows for the line chart with the LineBorder property and the EnhancedSolidLine class. You can also specify line style options such as dash, cap type, and so on.
Using Code
Create a line chart.
Create an EnhancedSolidLine object.
Set the LineBorder property.
Example
This example code creates a line chart with a line style that contains arrows.
FarPoint.Win.Chart.EnhancedSolidLine eh = new FarPoint.Win.Chart.EnhancedSolidLine(System.Drawing.Color.Green, 1, FarPoint.Win.Chart.CompoundType.Double, FarPoint.Win.Chart.DashType.Dash, FarPoint.Win.Chart.CapType.Flat, FarPoint.Win.Chart.JoinType.Round, FarPoint.Win.Chart.ArrowType.Arrow, FarPoint.Win.Chart.ArrowType.OpenArrow, 1, 2);
FarPoint.Win.Chart.LineSeries series1 = new FarPoint.Win.Chart.LineSeries();
series1.PointMarker = new FarPoint.Win.Chart.BuiltinMarker(FarPoint.Win.Chart.MarkerShape.Circle, 7.0f);
series1.PointFill = new FarPoint.Win.Chart.GradientFill(System.Drawing.Color.Coral, System.Drawing.Color.Crimson);
series1.PointBorder = new FarPoint.Win.Chart.SolidLine(System.Drawing.Color.Yellow);
series1.LineBorder = eh;
series1.Values.Add(8.0);
series1.Values.Add(12.0);
series1.Values.Add(14.0);
series1.Values.Add(15.0);
FarPoint.Win.Chart.YPlotArea plotArea = new FarPoint.Win.Chart.YPlotArea();
plotArea.Location = new System.Drawing.PointF(0.2f, 0.2f);
plotArea.Size = new System.Drawing.SizeF(0.6f, 0.6f);
plotArea.Series.Add(series1);
FarPoint.Win.Chart.LabelArea labelArea = new FarPoint.Win.Chart.LabelArea();
labelArea.Location = new System.Drawing.PointF(0.5f, 0.02f);
labelArea.AlignmentX = 0.5f;
labelArea.AlignmentY = 0.0f;
labelArea.Text = "Chart";
FarPoint.Win.Chart.ChartModel model = new FarPoint.Win.Chart.ChartModel();
model.LabelAreas.Add(labelArea);
model.PlotAreas.Add(plotArea);
FarPoint.Win.Spread.Chart.SpreadChart chart = new FarPoint.Win.Spread.Chart.SpreadChart();
chart.Size = new Size(200, 200);
chart.Location = new Point(100, 100);
chart.Model = model;
fpSpread1.Sheets[0].Charts.Add(chart);
Dim eh As New FarPoint.Win.Chart.EnhancedSolidLine(System.Drawing.Color.Green, 1, FarPoint.Win.Chart.CompoundType.Double, FarPoint.Win.Chart.DashType.Dash, FarPoint.Win.Chart.CapType.Flat, FarPoint.Win.Chart.JoinType.Round, FarPoint.Win.Chart.ArrowType.Arrow, FarPoint.Win.Chart.ArrowType.OpenArrow, 1, 2)
Dim series1 As New FarPoint.Win.Chart.LineSeries()
series1.PointMarker = New FarPoint.Win.Chart.BuiltinMarker(FarPoint.Win.Chart.MarkerShape.Circle, 7.0F)
series1.PointFill = New FarPoint.Win.Chart.GradientFill(System.Drawing.Color.Coral, System.Drawing.Color.Crimson)
series1.PointBorder = New FarPoint.Win.Chart.SolidLine(System.Drawing.Color.Yellow)
series1.LineBorder = eh
series1.Values.Add(8.0)
series1.Values.Add(12.0)
series1.Values.Add(14.0)
series1.Values.Add(15.0)
Dim plotArea As New FarPoint.Win.Chart.YPlotArea()
plotArea.Location = New System.Drawing.PointF(0.2F, 0.2F)
plotArea.Size = New System.Drawing.SizeF(0.6F, 0.6F)
plotArea.Series.Add(series1)
Dim labelArea As New FarPoint.Win.Chart.LabelArea()
labelArea.Location = New System.Drawing.PointF(0.5F, 0.02F)
labelArea.AlignmentX = 0.5F
labelArea.AlignmentY = 0.0F
labelArea.Text = "Chart"
Dim model As New FarPoint.Win.Chart.ChartModel()
model.LabelAreas.Add(labelArea)
model.PlotAreas.Add(plotArea)
Dim chart As New FarPoint.Win.Spread.Chart.SpreadChart()
chart.Size = New Size(200, 200)
chart.Location = New Point(100, 100)
chart.Model = model
fpSpread1.Sheets(0).Charts.Add(chart)Using the Chart Designer
Right-click on the line in the Line chart.
Select the Format Series menu.
Select the Line Border option.
Select Solid Line.
Set properties and close the dialog.