
-
Spread Windows Forms Product Documentation
- Getting Started
-
Developer's Guide
- Understanding the Product
- Working with the Component
- Spreadsheet Objects
- Ribbon Control
- Sheets
- Rows and Columns
- Headers
- Cells
- Cell Types
- Data Binding
- Customizing the Sheet Appearance
- Customizing Interaction in Cells
- Tables
- Pivot Table
- Understanding the Underlying Models
- Customizing Row or Column Interaction
- Formulas in Cells
- Sparklines
- Keyboard Interaction
- Events from User Actions
- File Operations
- Storing Excel Summary and View
- Printing
- Chart Control
- Enhanced Chart
- Customizing Drawing
- Touch Support with the Component
- Spread Designer Guide
- Assembly Reference
- Import and Export Reference
- Version Comparison Reference
Axis
An axis is used to display the scale for a single dimension of a plot area. An axis can have a title, a ruler line, major and minor tick marks, tick mark labels, major and minor grid lines, and stripes. The direction of the axis can be reversed. The minimum, maximum, major or minor tick, and label units can be automatically generated or manually assigned. The scale can be linear or logarithmic.
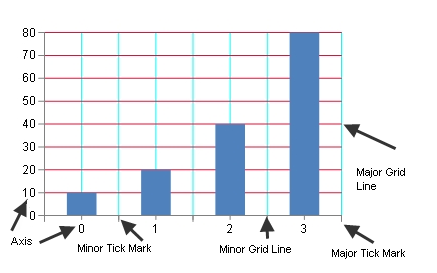
Tick marks and grids are used to mark individual values on the ruler. Tick marks are painted on the ruler while corresponding grids are painted on the wall(s). Stripes are used to highlight ranges of values. Stripes are painted on the wall(s).
!type=note
Note:
The title, ruler, tick marks (major and minor), tick mark labels, and grids (major and minor) can be hidden.
A font can be set for the title and tick marks and the title can be customized. The title and tick mark labels can have fill effects.
Length (measured in model units), can also be set for major and minor tick marks.
The axis can have lines for the ruler, major, and minor grids as well as a minimum and maximum value. The minimum and maximum values can be automatically generated by the chart view.
An axis can be assigned a collection of stripes.
The direction of the axis can be reversed.
For more information, see the following classes:
IndexAxis
An index axis is used to display integer values such as a category or series index. Tick marks, tick mark labels, and grid lines can be displayed on the integer values or between the integer values. Index axis is set using the IndexAxis class.
ValueAxis
A value axis is used to display double values (data values). The value axis can have a linear or logarithmic scale (when using a logarithmic scale, the value axis can use a logarithmic base). Value axis is set using the ValueAxis class.
Example
The following example sets a title for the axis.
FarPoint.Win.Chart.YPlotArea plotArea = new FarPoint.Win.Chart.YPlotArea();
plotArea.Location = new PointF(0.2f, 0.2f);
plotArea.Size = new SizeF(0.6f, 0.6f);
plotArea.XAxis.Title = "Categories";
plotArea.YAxes[0].Title = "Values";
Dim plotArea As New FarPoint.Win.Chart.YPlotArea()
plotArea.Location = New PointF(0.2F, 0.2F)
plotArea.Size = New SizeF(0.6F, 0.6F)
plotArea.XAxis.Title = "Categories"
plotArea.YAxes(0).Title = "Values"Using SPREAD Designer
Run the Chart Designer.
Expand the target Plot Area from the tree menu on the left.
Select X Index Axis and set the required properties in the property list on the right.
Expand Y Value Axis, select Axis0 and set the required properties in the property list on the right.
Click OK to exit Chart Designer.
!type=note
Note: For information on starting Chart Designer, refer to Chart Designer in the SPREAD Designer Guide.