


-
Spread Windows Forms Product Documentation
- Getting Started
-
Developer's Guide
- Understanding the Product
- Working with the Component
- Spreadsheet Objects
- Ribbon Control
- Sheets
- Rows and Columns
- Headers
- Cells
- Cell Types
- Data Binding
- Customizing the Sheet Appearance
- Customizing Interaction in Cells
- Tables
- Pivot Table
- Understanding the Underlying Models
- Customizing Row or Column Interaction
- Formulas in Cells
- Sparklines
- Keyboard Interaction
- Events from User Actions
- File Operations
- Storing Excel Summary and View
- Printing
- Chart Control
- Enhanced Chart
- Customizing Drawing
- Touch Support with the Component
- Spread Designer Guide
- Assembly Reference
- Import and Export Reference
- Version Comparison Reference
Multi-Level Category Labels
Multi-level category labels can simultaneously display both the main and subcategory labels present in the Index Axis. You can set the value of the MultiLevel property of the YPlotArea class to true to enable the display of multi-level category labels. By default, this property is set to false.
This feature is compatible with only Column, Line, Bar, and Area charts because these charts have axis that support multiple levels. On importing and exporting Excel format files, the multi-level category labels are maintained.
The following image depicts a Column chart with multi-level category labels.
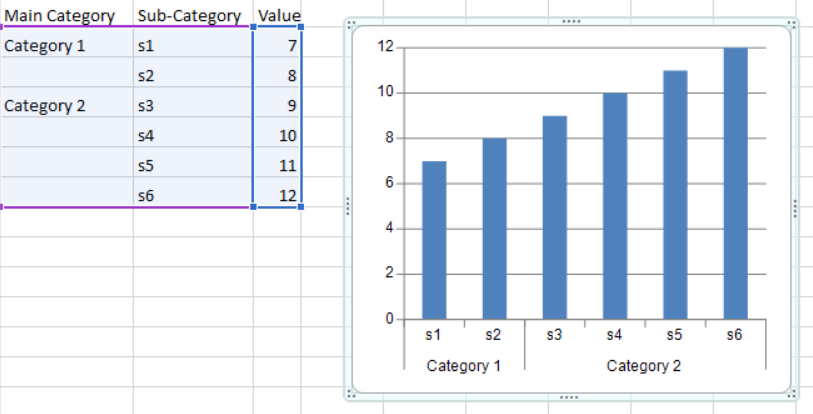
If the IndexAxis labels are oriented vertically in a chart, all category labels appear vertically, except the last subcategory label, which is displayed horizontally.
The following image depicts a Bar chart with multi-level category labels.
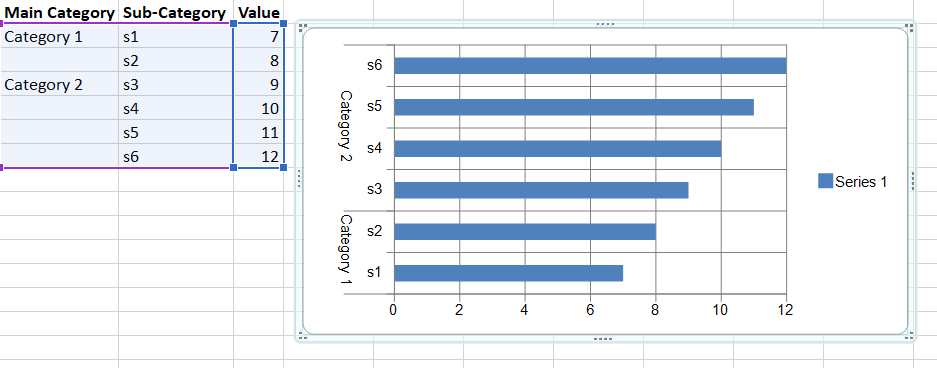
Using Code
The following sample code shows how to display multi-level category labels.
SheetView sheet1 = fpSpread1.ActiveSheet;
 sheet1.Cells[1, 1].Value = "s1";
 sheet1.Cells[2, 1].Value = "s2";
 sheet1.Cells[3, 1].Value = "s3";
 sheet1.Cells[4, 1].Value = "s4";
 sheet1.Cells[5, 1].Value = "s5";
 sheet1.Cells[6, 1].Value = "s6";
 sheet1.Cells[1, 2].Value = 7;
 sheet1.Cells[2, 2].Value = 8;
 sheet1.Cells[3, 2].Value = 9;
 sheet1.Cells[4, 2].Value = 10;
 sheet1.Cells[5, 2].Value = 11;
 sheet1.Cells[6, 2].Value = 12;
 sheet1.Cells[1, 0].Value = "Category1";
 sheet1.Cells[3, 0].Value = "Category2";
 FarPoint.Win.Spread.Model.CellRange range = new FarPoint.Win.Spread.Model.CellRange(1, 0, 6, 3);
 sheet1.AddChart(range, typeof(BarSeries), 300, 300, 200, 100, ChartViewType.View2D, false);
 YPlotArea plotArea = (YPlotArea)(fpSpread1.Sheets[0].Charts[0].Model.PlotAreas[0]);
 plotArea.XAxis.MultiLevel = true;
Dim sheet1 As SheetView = FpSpread1.ActiveSheet
sheet1.Cells(1, 1).Value = "s1"
sheet1.Cells(2, 1).Value = "s2"
sheet1.Cells(3, 1).Value = "s3"
sheet1.Cells(4, 1).Value = "s4"
sheet1.Cells(5, 1).Value = "s5"
sheet1.Cells(6, 1).Value = "s6"
sheet1.Cells(1, 2).Value = 7
sheet1.Cells(2, 2).Value = 8
sheet1.Cells(3, 2).Value = 9
sheet1.Cells(4, 2).Value = 10
sheet1.Cells(5, 2).Value = 11
sheet1.Cells(6, 2).Value = 12
sheet1.Cells(1, 0).Value = "Category1"
sheet1.Cells(3, 0).Value = "Category2"
Dim range As FarPoint.Win.Spread.Model.CellRange = New FarPoint.Win.Spread.Model.CellRange(1, 0, 6, 3)
sheet1.AddChart(range, GetType(BarSeries), 300, 300, 200, 100, ChartViewType.View2D, False)
Dim plotArea As YPlotArea = CType((fpSpread1.Sheets(0).Charts(0).Model.PlotAreas(0)), YPlotArea)
plotArea.XAxis.MultiLevel = TrueUsing Designer
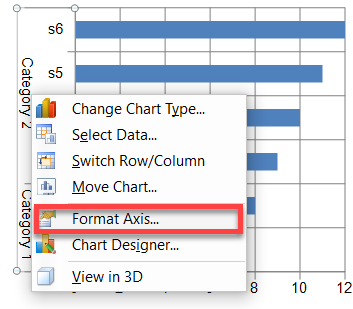
Select the X Index Axis or Y Value Axis in the chart area and Right-click.
Select the Format Axis… menu.
Select the Label option.
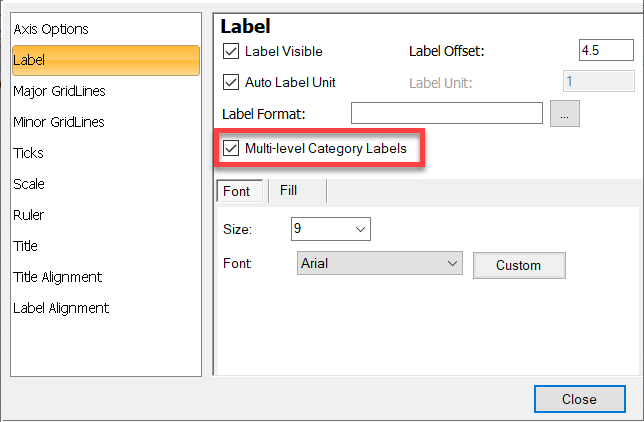
Enable the Multi-level Category Labels check box and close the dialog.