
- ASP.NET MVC
- Getting Started
- Configuring your MVC Application
- Adding NuGet Packages to your App
- Adding Controls
- Client-Side Support
- Globalization
- Working with Controls
- Styling
- ASP.NET MVC Samples
- Release History
Flexible Layout
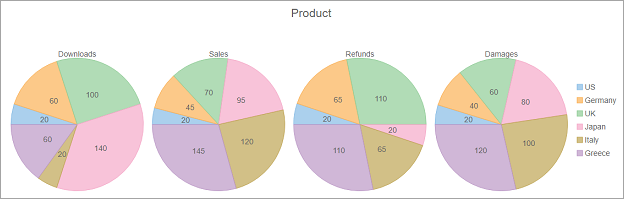
FlexPie supports multiple pie charts in one chart surface with the ability to control the layout of the charts. This option gives you much more control over how FlexPie fits into your application. FlexPie allows you to define how many charts you want to display in a line before wrapping to the next line using the ChartsPerLine property.
Here is how the default rendering of FlexPie with four charts looks like:
And if the ChartsPerLine is set to two, then we get the following result:
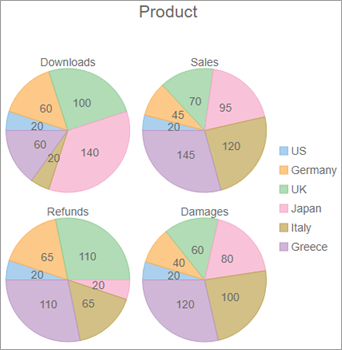
The following code demonstrates how to set the chart layout using the ChartsPerLine property. This code uses data from the ProductSales class.
ProductSales Data
public class ProductSales
{
    public string Country { get; set; }
    public int Downloads { get; set; }
    public int Sales { get; set; }
    public int Refunds { get; set; }
    public int Damages { get; set; }
    public static List<ProductSales> GetData()
    {
        var countries = "US,Germany,UK,Japan,Italy,Greece".Split(new char[] { ',' });
        var data = new List<ProductSales>();
        for (var i = 0; i < countries.Length; i++)
        {
            data.Add(new ProductSales()
            {
                Country = countries[i],
                Downloads = ((i % 4) * 40) + 20,
                Sales = ((i % 7) * 25) + 20,
                Refunds = ((i % 3) * 45) + 20,
                Damages = ((i % 9) * 20) + 20
            });
        }
        return data;
    }
}
Controller Code
public ActionResult Index()
{
    return View(ProductSales.GetData());
}
View Code
@model IEnumerable<ProductSales>
@(Html.C1().FlexPie<ProductSales>()
        .Id("multipleChart")
        .Header("Product")
        .Height(500)
        .Binding("Downloads,Sales,Refunds,Damages")
        .Bind(Model)
        .BindingName("Country")
        .DataLabel(dl => dl.Content("{value}"))
        .ChartsPerLine(2))