- ASP.NET MVC
- Getting Started
- Configuring your MVC Application
- Adding NuGet Packages to your App
- Adding Controls
- Client-Side Support
- Globalization
- Working with Controls
- Styling
- ASP.NET MVC Samples
- Release History
Range Selector
FinancialChart's RangeSelector lets a user select a specific range of data to be displayed on the chart. A user can easily bind the RangeSelector with various types of financial charts. It is mostly used by finance industry to perform stock analysis on different data ranges.
The RangeSelector has a left thumb (for minimum value) and right thumb (for maximum value) that lets you scroll through particular time periods on the chart. Users can change the minimum and maximum values of the RangeSelector, and adjust the visible range of data on the chart by dragging these thumbs to left or right. On dragging the thumb towards left on the range bar, you reduce its value, and dragging it towards the right increases its value on the range bar.
type=note
To set the minimum and maximum range in code, use the Min and Max properties of the RangeSelector.
You can change the position of the thumbs by setting the value of RangeSelector's Orientation property to X (default) or Y.
.Orientation(C1.Web.Mvc.Chart.Orientation.Y)
On setting the orientation to Y, the left and right thumbs get aligned as the lower and upper thumb on the RangeSelector, and can be dragged up or down to increase or decrease the values, and specify the visible range of data on the chart.
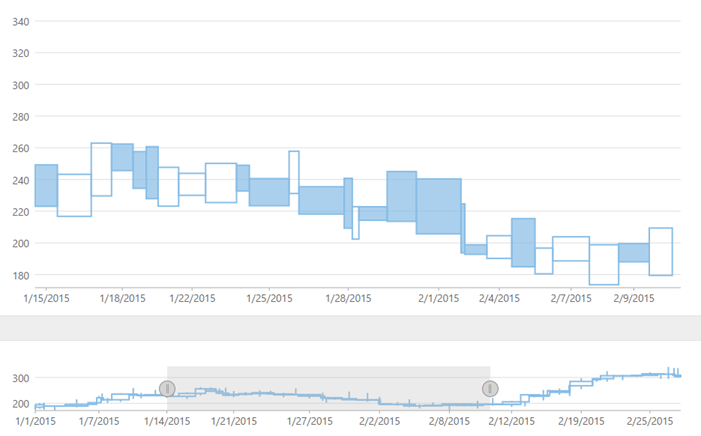
The image below shows how the FinancialChart appears after a RangeSelector is added to it.

The following code example demonstrates how to display thumb values using a range selector on the FinancialChart.
@using MVCFinancialChart.Models
@model List<FinanceData>
<script type="text/javascript">
    var tooltipContent = function (ht) {
        var item = ht.series.collectionView.items[ht.pointIndex];
        if (item) {
            return 'Date: ' + wijmo.Globalize.format(ht.x, 'MMM-dd') + '<br/>' +
             'High: ' + item.High.toFixed() + '<br/>' +
             'Low: ' + item.Low.toFixed() + '<br/>' +
             'Open: ' + item.Open.toFixed() + '<br/>' +
             'Close: ' + item.Close.toFixed() + '<br/>' +
             'Volume: ' + item.Volume.toFixed() + '<br/>'
        }
    };
    function rangeChanedHandler(sender, e) {
        var stChart = wijmo.Control.getControl("#FinancialChart"),
            rs = wijmo.Control.getControl("#rs").extenders[0];
        if (stChart && rs) {
            stChart.axisX.min = rs.min;
            stChart.axisX.max = rs.max;
            stChart.invalidate();
        }
    }
</script>
@*Initialize Financialchart control*@
@(Html.C1().FinancialChart()
.Id("FinancialChart")
.Bind(Model)
.BindingX("X")
.ChartType(C1.Web.Mvc.Chart.Finance.ChartType.EquiVolume)
.Series(sers =>
    {
        sers.Add().Binding("High,Low,Open,Close,Volume");
    })
.Tooltip(t => t.Content("tooltipContent")))
<p></p>
<br />
@(Html.C1().FinancialChart()
.Id("rs")
.Height("100px")
.Bind(Model)
.BindingX("X")
.ChartType(C1.Web.Mvc.Chart.Finance.ChartType.CandleVolume)
.Series(sers =>
    {
        sers.Add().Binding("High,Low,Open,Close,Volume");
    })
    //Add a range selector.
.AddRangeSelector(rs => rs.OnClientRangeChanged("rangeChanedHandler") .Orientation(C1.Web.Mvc.Chart.Orientation.Y))
.Tooltip(t => t.Content("")))


