- ASP.NET MVC
- Getting Started
- Configuring your MVC Application
- Adding NuGet Packages to your App
- Adding Controls
- Client-Side Support
- Globalization
- Working with Controls
- Styling
- ASP.NET MVC Samples
- Release History
Disabled and Invisible Tabs
TabPanel control allows the user to disable or hide individual tabs using the isDisabled and isVisible properties respectively.
This topic includes the following sections.
Disabled Tabs
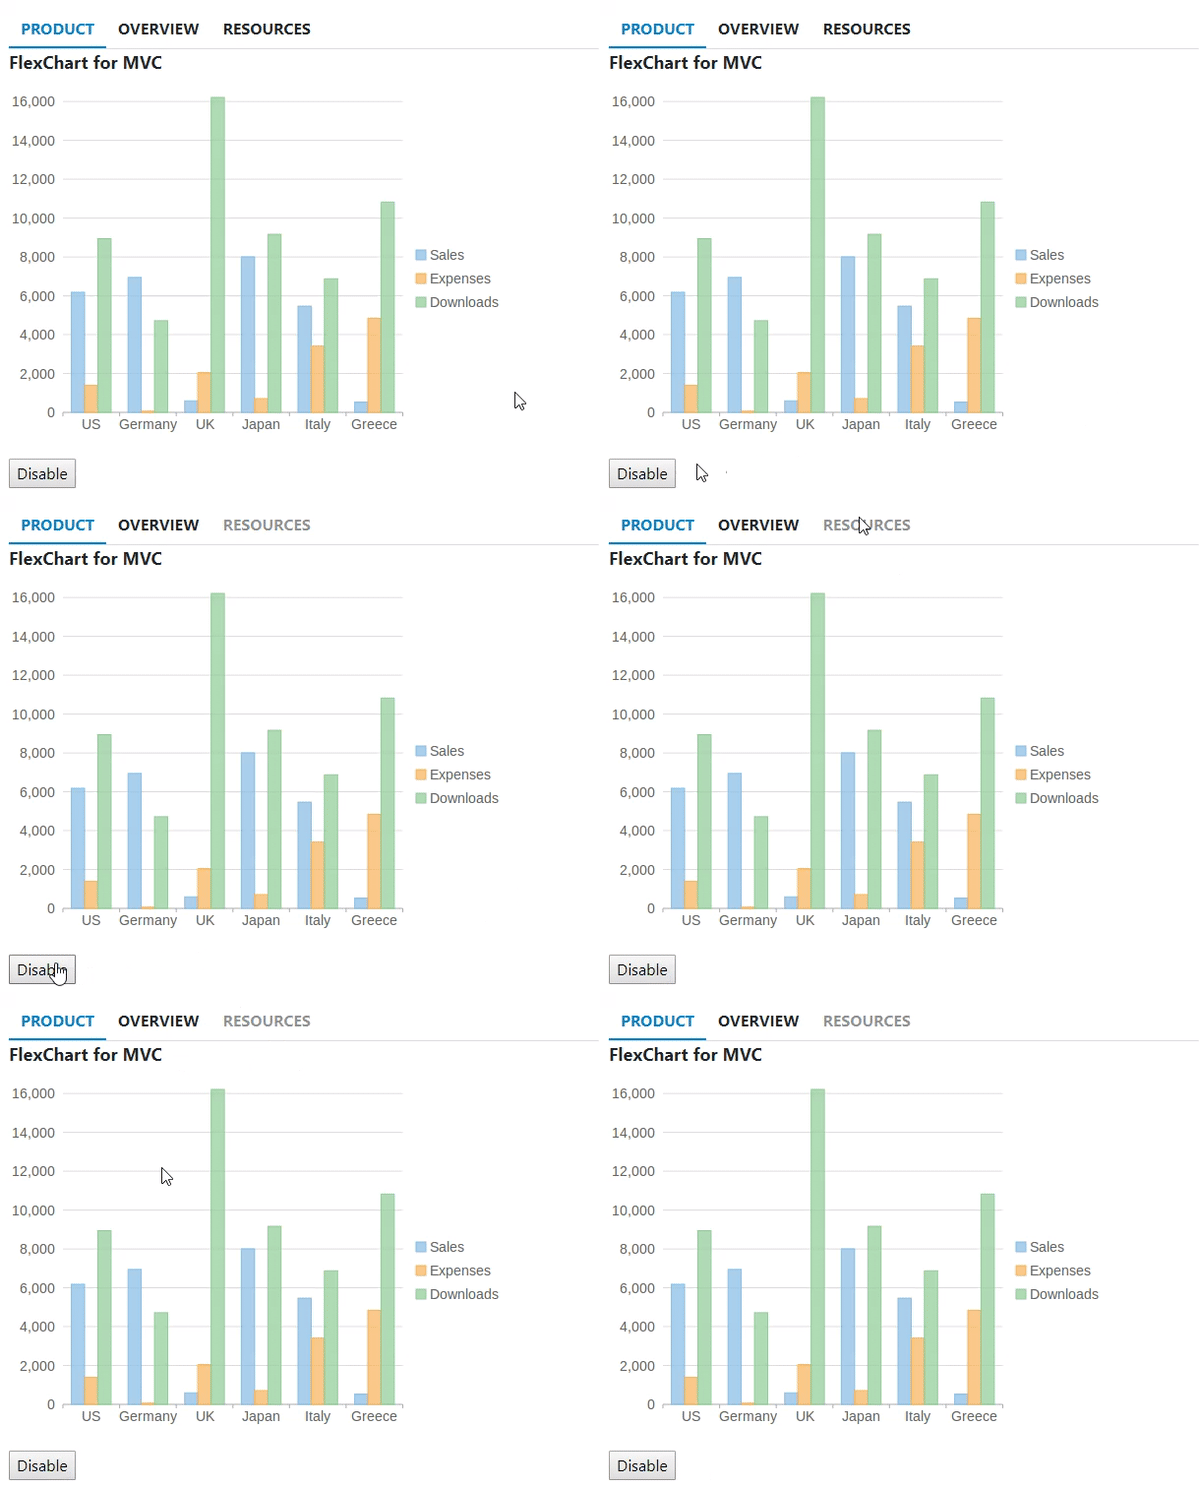
The following GIF image shows how TabPanel appears after setting the isDisabled property to true.
The following code example demonstrates how to disable any particular tab in the TabPanel control.
<script>
    function customChangeDisableResources(control) {
        var control = wijmo.Control.getControl("#tabPanel");
        control.getTab('tab-resources').isDisabled = true;
    }
</script>
<br />
<div id="tabPanel" style="width:500px">
    <div>
        <a>Product</a>
        <div>
            <p style="font-size:large"><b>FlexChart for MVC</b></p>
            <img src="~/flexchart.png" />
        </div>
    </div>
    <div>
        <a>Overview</a>
        <div>
        <p>
        <b>FlexChart</b>—a powerful data visualization control for Web—lets you add feature-rich and
        visually appealing charts to your MVC applications.     The control empowers end-users to visualize data that
        resonates with their audiences. The FlexChart control provides you with numerous 2D chart types,
        built-in tools for chart interactivity, and diversified formats for chart rendering. Whether it is
        storytelling with data or interpreting complex data, FlexChart helps you accomplish everything seamlessly.
        </p>
        </div>
    </div>
    <div>
        <a id="tab-resources" >Resources</a>
        <div>
            <ul>
                <li><a href="http://developer.mescius.com/componentone/NetHelp/FlexChartWin/webframe.html#FlexChart.html">Documentation</a></li>
                <li><a href="https://developer.mescius.com/en/demos">Demo</a></li>
                <li><a href="https://developer.mescius.com/en/forums">Forums</a></li>
            </ul>
        </div>
    </div>
</div><br />
<input type="button" onclick="customChangeDisableResources()" value="Disable"/>
@(Html.C1().TabPanel("#tabPanel"))
Invisible Tabs
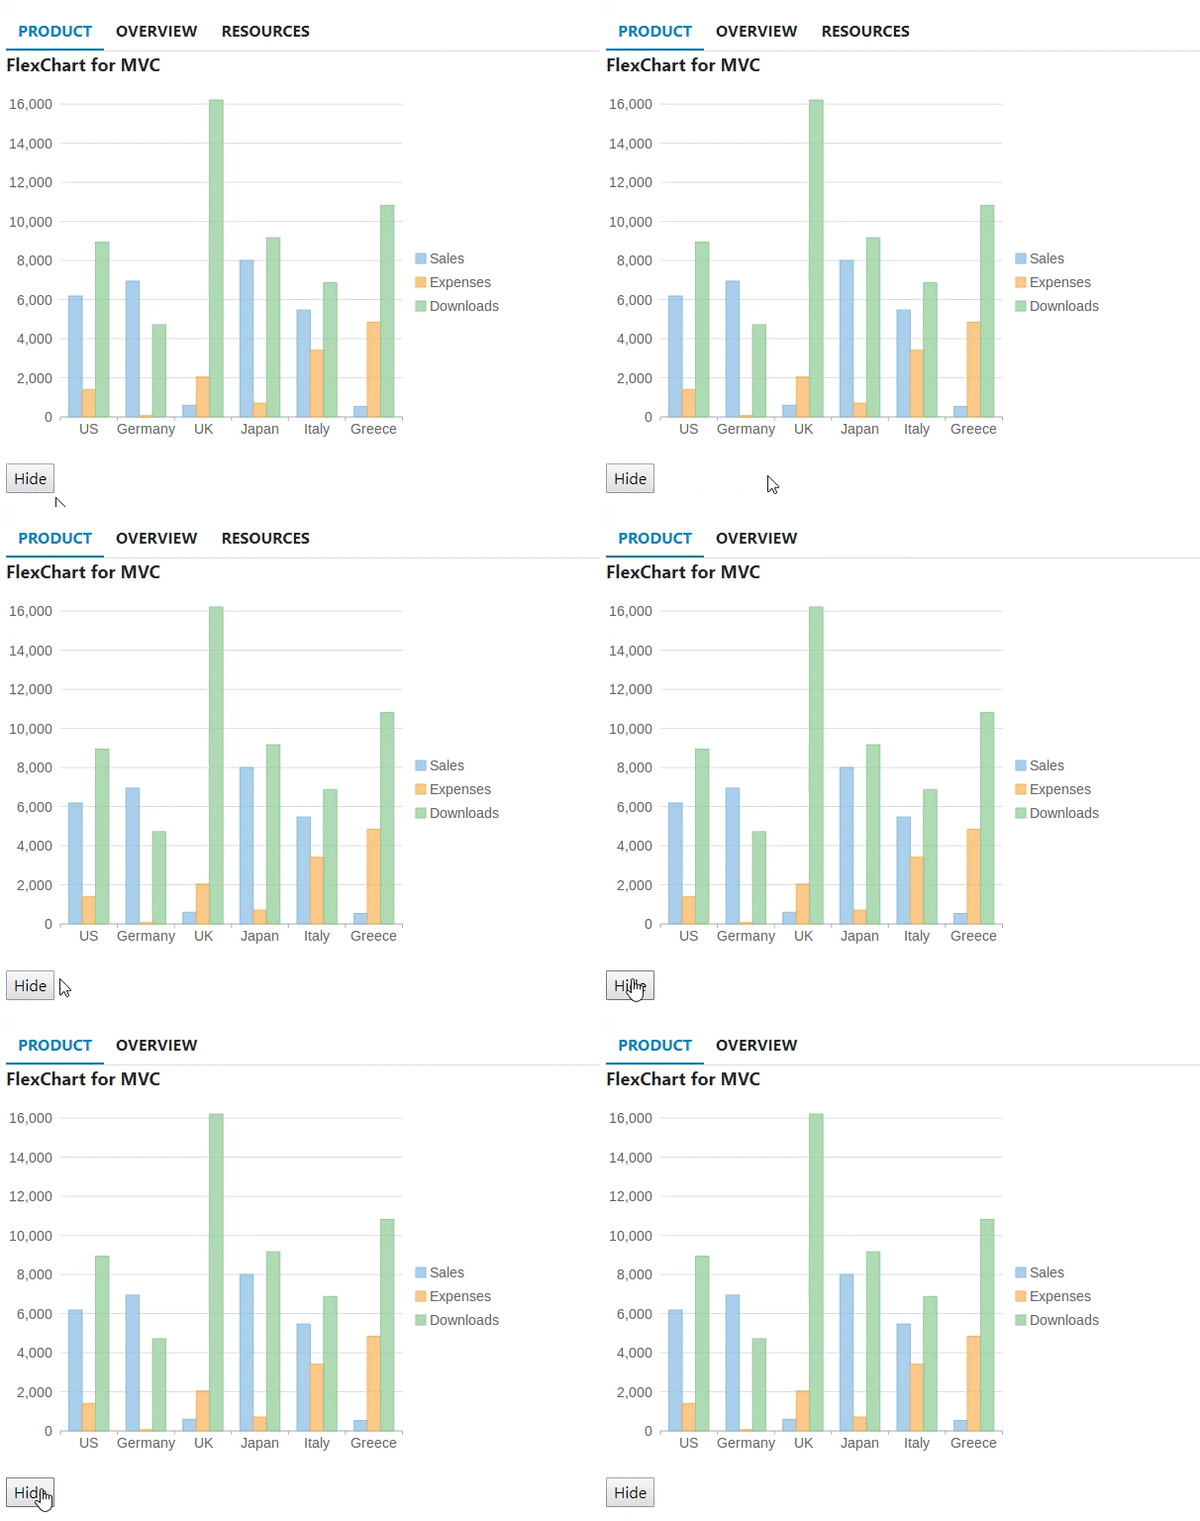
The following GIF image shows how TabPanel appears after setting the isVisible property to false.
The following code example demonstrates how to hide any particular tab in the TabPanel control.
<script>
    function customChangeHideResources(control) {
        var control = wijmo.Control.getControl("#tabPanel");
        control.getTab('tab-resources').isVisible = false;
    }
</script>
<br />
<div id="tabPanel" style="width:500px">
    <div>
        <a>Product</a>
        <div>
            <p style="font-size:large"><b>FlexChart for MVC</b></p>
            <img src="~/flexchart.png" />
        </div>
    </div>
    <div>
        <a>Overview</a>
        <div>
            <p>                <b>FlexChart</b>—a powerful data visualization control for Web—lets you add feature-rich and visually appealing charts to your MVC applications.                The control empowers end-users to visualize data that resonates with their audiences.                The FlexChart control provides you with numerous 2D chart types, built-in tools for chart interactivity, and diversified formats for chart rendering.                Whether it is storytelling with data or interpreting complex data, FlexChart helps you accomplish everything seamlessly.            </p>
        </div>
    </div>
    <div>
        <a id="tab-resources">Resources</a>
        <div>
            <ul>
                <li><a href="http://developer.mescius.com/componentone/NetHelp/FlexChartWin/webframe.html#FlexChart.html">Documentation</a></li>
                <li><a href="https://developer.mescius.com/en/demos">Demo</a></li>
                <li><a href="https://developer.mescius.com/en/forums">Forums</a></li>
            </ul>
        </div>
    </div>
</div><br />
<input type="button" onclick="customChangeHideResources()" value="Hide" />
@(Html.C1().TabPanel("#tabPanel")))


