- ASP.NET MVC
- Getting Started
- Configuring your MVC Application
- Adding NuGet Packages to your App
- Adding Controls
- Client-Side Support
- Globalization
-
Working with Controls
- Accordion
- Barcode
- CollectionView
- DashboardLayout
- Excel
- File Manager
- Financial Charts
- FlexChart
- FlexGrid
- Transposed Grid
- FlexMap
- FlexPie
- FlexRadar
- FlexReport
- FlexSheet
- FlexViewer
- Gauge
- Input Controls
- MultiRow
- TransposedMultiRow
- OLAP
- Sunburst Chart
- TabPanel
- TreeMap
- TreeView
- Styling
- ASP.NET MVC Samples
- Release History
Legend
Legend is a chart element which displays a list of colors, symbols and text corresponding to each data series drawn on that chart. It helps in understanding and analysis of the plotted data in the case of multiple series.
FlexChart automatically places the legend according to the space available on the chart area. However, you can also set it to display at top, bottom, left or right with respect to the plot area by setting the Position property. In addition, you can toggle the visibility of any series by clicking its corresponding legend item using the LegendToggle property. Moreover, FlexChart allows you to set the orientation of the legend using the Legend.Orientation property which accepts values from the LegendOrientation enumeration which provides the following orientations:
- Auto - Sets the orientation automatically based on the legend position.
- Vertical - Sets vertical orientation for the legend.
- Horizontal - Sets horizontal orientation for the legend.
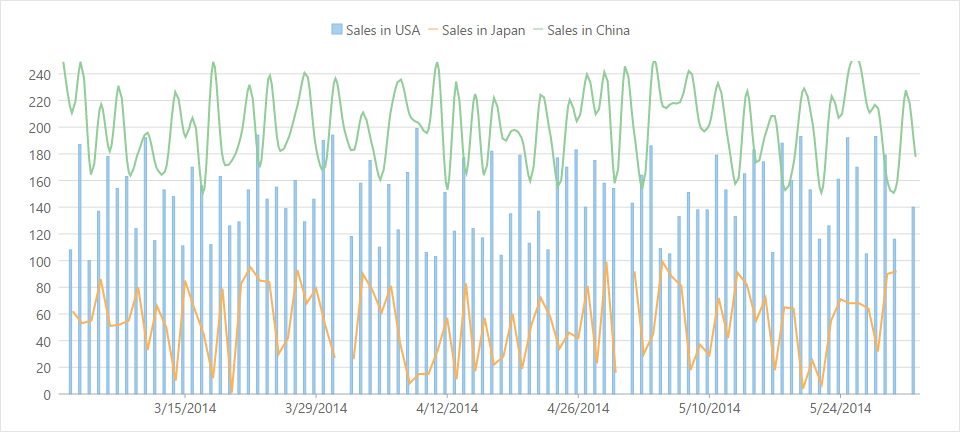
The image below shows how the FlexChart appears after these properties have been set.

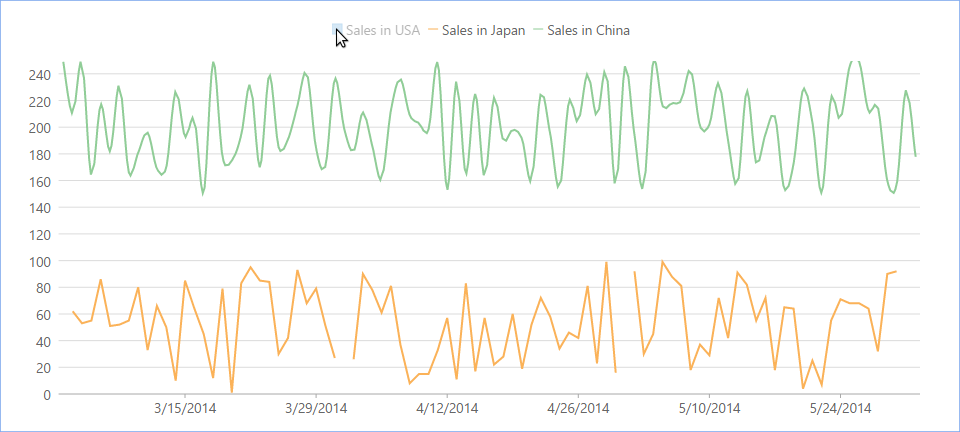
Clicking the legend item makes the corresponding series invisible as shown below.

The following code example demonstrates how to set these properties. This example uses the sample created in the Mixed Charts section.
.Legend(C1.Web.Mvc.Chart.Position.Top)
.LegendToggle(true)
.Legend(C1.Web.Mvc.Chart.LegendOrientation.Auto)


