An axis is composed of several elements, such as labels, line, tick marks and titles. There are several properties available in FlexChart that let you customize these elements, for both X and Y axes. You can even change the position of the axes with the help of Position property.
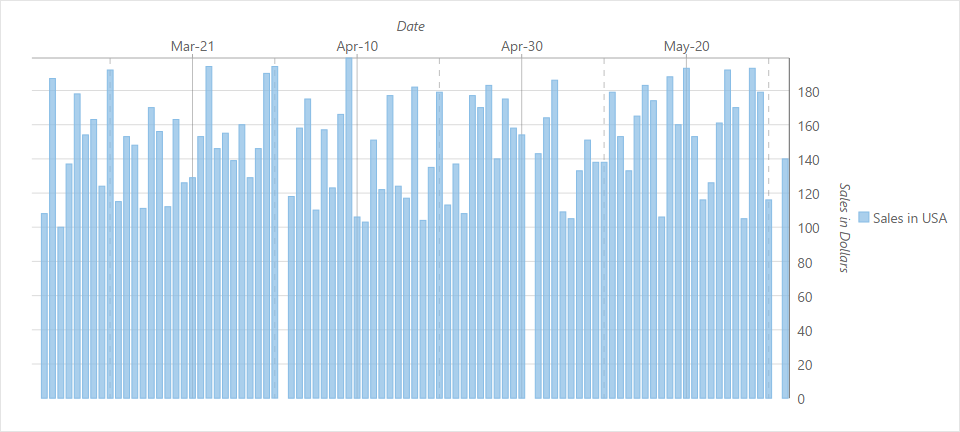
The image below shows a FlexChart with customized axes.

The following code example demonstrates how to set this property. This example uses the sample created in the Quick Start section.
| HTML |
Copy Code
|
|---|---|
<c1-flex-chart binding-x="Name" chart-type="ChartType.Column" > <c1-items-source source-collection="Model"></c1-items-source> <c1-flex-chart-series binding="SalesInUSA" name="Sales in USA" chart-type="ChartType.Column"> <c1-flex-chart-axis c1-property="AxisX" position="Position.Right" major-grid="true" major-unit="20" axis-line="true" labels="true" title="Sales in Dollars" ></c1-flex-chart-axis> </c1-flex-chart-series> <c1-flex-chart-axis c1-property="AxisY" format="dd-MMM" position="Position.Top" major-grid="true" major-unit="20" axis-line="true" labels="true" title="Date"></c1-flex-chart-axis> </c1-flex-chart> |
|