- Getting Started
- Configuring your MVC Application
- Adding NuGet Packages to your App
- Adding Controls
- Client-Side Support
-
Working with Controls
- Accordion
- Barcode
- CollectionView
- DashboardLayout
- File Manager
- Financial Charts
- FlexChart
- FlexGrid
- Transposed Grid
- FlexMap
- Flex Pie
- Flex Radar
- Flex Report
- Flex Sheet
- Flex Viewer
- Gauge
- Input Controls
- Multi Row
- TransposedMultiRow
- OLAP
- Sunburst Chart
- Tab Panel
- Tree Map
- TreeView
- Globalization
- Styling
- ASP.NET MVC Samples
- ReleaseHistory
Range Selector
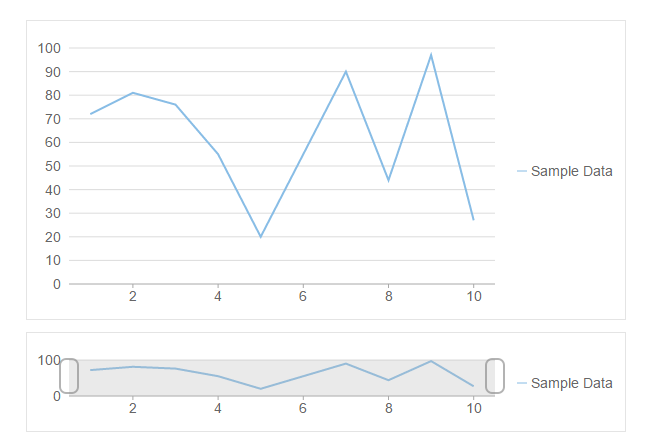
FlexChart's Range Selector lets you select a range of numeric data with lower value thumb and upper value thumb. These thumbs define the start and end values of the range. On dragging the thumb towards left (or down) on the range bar, you reduce its value, and dragging it towards the right (or up) increases the value on the range bar. You can set the minimum and maximum bounds for thumb values using Min and Max properties.
The thumb value must be more than the minimum bound and less than the maximum bound set for the range selector. You can also set the position of a range selector using the Orientation property.
The image below shows how the FlexChart appears after these properties have been set.

The following code example demonstrates how to display thumb values using a range selector on the FlexChart.
<c1-flex-chart binding-x="Name" chart-type="ChartType.Line" legend-position="Position.Right"
             width="600px" height="300px" legend-toggle="true">
    <c1-items-source source-collection="Model"></c1-items-source>
    <c1-flex-chart-series binding="Y" name="Sample Data"></c1-flex-chart-series>
</c1-flex-chart>
  <script type="text/javascript">
    function rangeChanged(rs, ui) {
    updateStChartRange(rs.min, rs.max);
    }
</script>
<c1-flex-chart binding-x="Name" chart-type="ChartType.Line" legend-position="Position.Right"
               width="600px" height="100px" legend-toggle="true">
    <c1-items-source source-collection="Model"></c1-items-source>
    <c1-flex-chart-series binding="Y" name=Sample Data"></c1-flex-chart-series>

    <c1-range-selector is-visible="true" min="0" max="100" range-changed="rangeChanged" ></c1-range-selector>
</c1-flex-chart>


