
- Getting Started
- Configuring your MVC Application
- Adding NuGet Packages to your App
- Adding Controls
- Client-Side Support
-
Working with Controls
- Accordion
- Barcode
- CollectionView
- DashboardLayout
- File Manager
- Financial Charts
- FlexChart
- FlexGrid
- Transposed Grid
- FlexMap
- Flex Pie
- Flex Radar
- Flex Report
- Flex Sheet
- Flex Viewer
- Gauge
- Input Controls
- Multi Row
- TransposedMultiRow
- OLAP
- Sunburst Chart
- Tab Panel
- Tree Map
- TreeView
- Globalization
- Styling
- ASP.NET MVC Samples
- ReleaseHistory
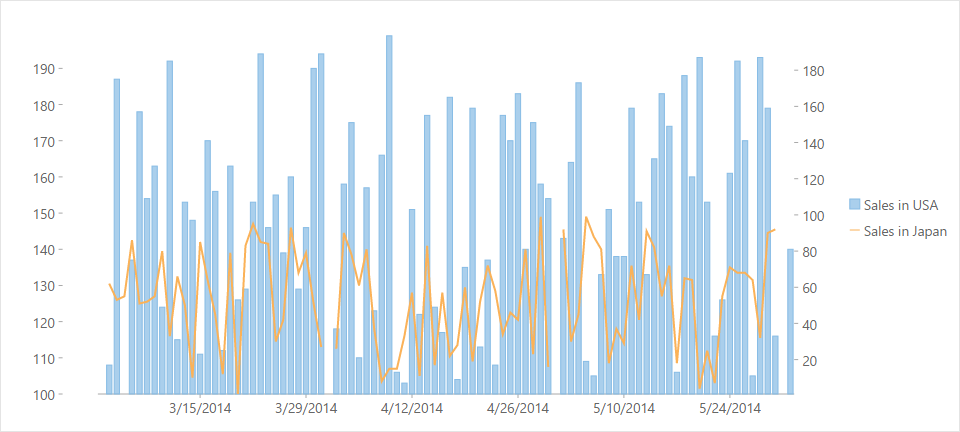
Multiple Axes
FlexChart allows you to add secondary axes when you add multiple series to the chart. The scale of a secondary axis represents the values of its associated series. You can even change the [ChartType](/componentone/api/mvc/online-mvc-core/dotnet-api/C1.AspNetCore.Mvc/C1.Web.Mvc.Chart.ChartType.html) of the associated series to easily identify the values plotted along the secondary axis.
The image below shows how multiple Y axes appear on the FlexChart.
The following code example demonstrates how to add multiple Y axes to the FlexChart. This example uses the sample created in the Mixed Charts section.
<c1-flex-chart binding-x="Name" chart-type="ChartType.Column">
    <c1-items-source source-collection="Model"></c1-items-source>
    <c1-flex-chart-series binding="SalesInUSA" name="Sales in USA" chart-type="ChartType.Column"
                         >
        <c1-flex-chart-axis c1-property="AxisX" format="dd-MMM"></c1-flex-chart-axis>
    </c1-flex-chart-series>
    <c1-flex-chart-series binding="SalesInJapan" name="Sales in Japan" chart-type="ChartType.Line">
    </c1-flex-chart-series>
</c1-flex-chart>