
- Getting Started
- Configuring your MVC Application
- Adding NuGet Packages to your App
- Adding Controls
- Client-Side Support
-
Working with Controls
- Accordion
- Barcode
- CollectionView
- DashboardLayout
- File Manager
- Financial Charts
- FlexChart
- FlexGrid
- Transposed Grid
- FlexMap
- Flex Pie
- Flex Radar
- Flex Report
- Flex Sheet
- Flex Viewer
- Gauge
- Input Controls
- Multi Row
- TransposedMultiRow
- OLAP
- Sunburst Chart
- Tab Panel
- Tree Map
- TreeView
- Globalization
- Styling
- ASP.NET MVC Samples
- ReleaseHistory
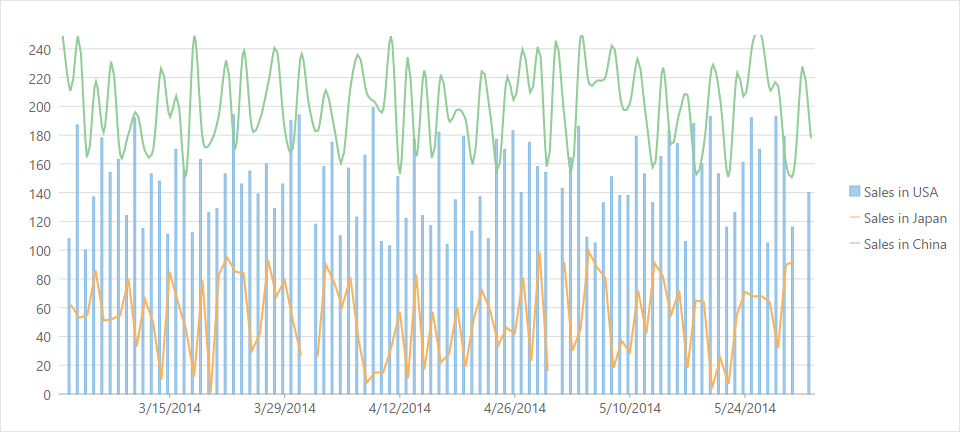
Mixed Charts
You can add multiple series to your charts and set a different [ChartType](/componentone/api/mvc/online-mvc-core/dotnet-api/C1.AspNetCore.Mvc/C1.Web.Mvc.Chart.ChartType.html) for all the series. Such charts are helpful in analyzing complex chart data on a single canvas. The same data can be used with different visualizations or related data can be displayed together to convey trends.
The following image shows a FlexChart with multiple series.
The following code example demonstrates how to add multiple chart series with different [ChartType](/componentone/docs/mvc/online-mvc-core/WorkingwithControls/FlexChart/Chart-Types)s to the FlexChart.
<c1-flex-chart binding-x="Name" chart-type="ChartType.Column" >
    <c1-items-source source-collection="Model"></c1-items-source>
    <c1-flex-chart-series binding="SalesInUSA" name="Sales in USA" chart-type="ChartType.Column"> </c1-flex-chart-series>
    <c1-flex-chart-series binding="SalesInJapan" name="Sales in Japan" chart-type="ChartType.Line"> </c1-flex-chart-series>
    <c1-flex-chart-series binding="SalesInChina" name="Sales in China" chart-type="ChartType.Spline">
        </c1-flex-chart-series>
</c1-flex-chart>