- Getting Started
- Configuring your MVC Application
- Adding NuGet Packages to your App
- Adding Controls
- Client-Side Support
-
Working with Controls
- Accordion
- Barcode
- CollectionView
- DashboardLayout
- File Manager
- Financial Charts
- FlexChart
- FlexGrid
- Transposed Grid
- FlexMap
- Flex Pie
- Flex Radar
- Flex Report
- Flex Sheet
- Flex Viewer
- Gauge
- Input Controls
- Multi Row
- TransposedMultiRow
- OLAP
- Sunburst Chart
- Tab Panel
- Tree Map
- TreeView
- Globalization
- Styling
- ASP.NET MVC Samples
- ReleaseHistory
Markers
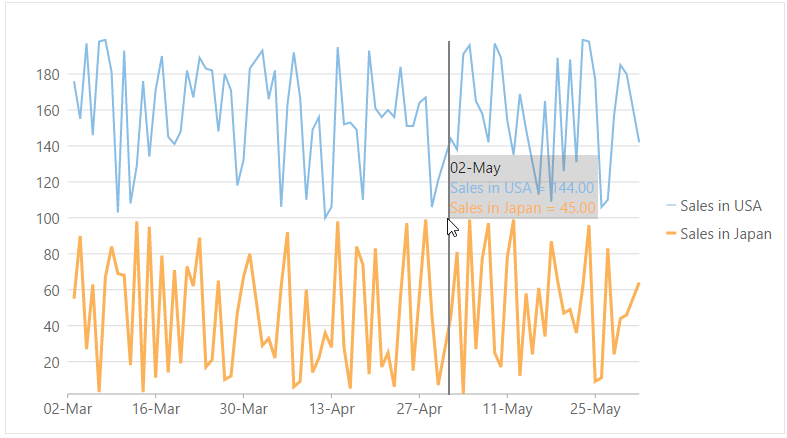
Markers are the symbols used to display data points when the mouse is hovered over the data series. In FlexChart, you can add line markers using AddLineMarker method. LineMarkerLines property allows you to set line markers to:
- Vertical: Shows vertical line markers.
- Horizontal: Shows horizontal line markers.
- Both: Sets vertical as well as horizontal line markers.
- None: Shows no line.
The image below shows vertical line marker with marker content to display the value of data points on the FlexChart.

The following code example demonstrates how to add vertical line markers and marker content to the FlexChart. This example uses the sample created in the Quick Start section.
@using C1.Web.Mvc.Chart;
@using TagFlexGrid.Models;
<script type="text/javascript">
    function lineMarkerContent(hitInfo, pt) {
        var html = '', chart = hitInfo.series ? hitInfo.series.chart : undefined;
        if (!chart || !chart.series) {
            return html;
        }
        chart.series.forEach(function (s, i) {
            var ht = s.hitTest(new wijmo.Point(pt.x, NaN)),
        hostEle = s.hostElement, polyline;
            polyline = s.hostElement ? s.hostElement
        .getElementsByTagName("polyline")[0] : undefined;
            if (polyline && ht.x && ht.y !== null) {
                if (i == 0) {
                    html += wijmo.Globalize.formatDate(ht.x, 'dd-MMM');
                }
                html += '<div style="color:' + polyline.getAttribute('stroke')
         + '">' + ht.name + ' = ' + ht.y.toFixed(2) + '</div>';
            }
        });
        return html;
    }
</script>
<c1-flex-chart
               binding-x="Date"
               chart-type="ChartType.Line"
               width="780px"
               interpolate-nulls="true">
    <c1-items-source source-collection="Model"></c1-items-source>
    <c1-flex-chart-series binding="SalesInUSA" name="Sales In USA">
      </c1-flex-chart-series>
    <c1-flex-chart-series binding="SalesInJapan" name="Sales In Japan" >
    </c1-flex-chart-series>
    <c1-flex-chart-axis c1-property="AxisX" format="dd-MMM"></c1-flex-chart-axis>
    <c1-flex-chart-tooltip content=""></c1-flex-chart-tooltip>
    <c1-line-marker alignment="LineMarkerAlignment.Auto"
                    lines="LineMarkerLines.Vertical"
                    drag-content="true"
                    interaction="LineMarkerInteraction.Move"
                    content="lineMarkerContent">
    </c1-line-marker>
</c1-flex-chart>


