
RDLX Report
The RDLX report (.rdlx), provides you the ability to define multiple layouts in a report for the flexible presentation of your report data. In this report, you can place data regions that require different viewing layouts, on separate sections, and set margins, page size, and page orientation for pages in each section to accommodate the data regions.
An RDLX report has the following additional features.
Key Features
Manage Report Sections
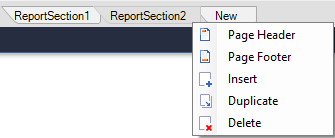
You can add new sections from the New tab that appears below the design area. You can also add new sections by right-clicking the ReportSection tab and selecting the Insert option from the context menu. To duplicate the report section, select the Duplicate option from the context menu. You can drag the section tabs to reorder report sections.
You can also change the report section's name using the Name property. Just right-click on the section's name (for example, ReportSection2) to quickly add a Page Header or Page Footer to the section or Delete the section. A report section can have its own page header or footer.
The report sections can be added to the viewer's Document Map for ease of navigation through the report. To do so, simply set the report section’s Label property. For more information, see the Document Map topic.
To control the visibility of the initial state of the section, use the Hidden property from the Properties panel and enter a Boolean value or an expression that evaluates to a Boolean value. See the topic to Hide or Show Sections in RDLX and RDLX Dashboard Reports.
Also see Quick Start topic that adds two report sections to create the report.
Set Layout of each Section
The layout of pages in each report section can be independently controlled using the following properties:
Margins - Left, Right, Top, Bottom
PageSize
PaperOrientation - Landscape, Portrait
Merge Reports
You can combine multiple report types (.rdlx) into a single report using ReportCombiner.Mode property in code.
While SubReports mode combines multiple reports as subreports, the ReportSections mode converts the reports being combined to a report with multiple report sections, that is, the output is an RDLX report. See Merge Multiple Reports for more information.
Create Report Parts for use in WebDesigner
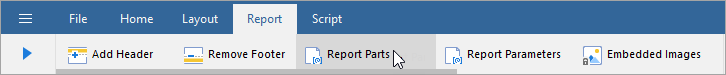
The report lets you create report parts and the collection of these, called the report library, can be reused in WebDesigner. Use the Report menu > Report Parts option in the toolbar or from the Properties panel > ReportParts collection.
See creating Report Parts for more information.