
- Introduction
- Report Readers
-
Report Authors
- Standalone Designer
- WebDesigner
- Report Types
-
Report Controls
- Report Controls in Page/RDLX Report
- Report Controls in Section Report
- Report Wizard
- Data Binding
- Design Reports
- DevOps
- Developers
- Samples
- Troubleshooting
Chart
A Chart data region lets you visualize your data graphically at a glance. The various chart types allow you to represent your data in the best suitable way. It is important to understand the fundamentals, such as the elements that define the context of the chart, the wizard that quickly guides you through the steps of creating a chart, the areas for adding and grouping data in the chart, and the panels and adorners available for accessing the chart properties and performing quick actions.
This article provides information about the chart elements. Further subtopics provide details on every other aspect of charts that will help you design any chart supported by ActiveReports.
Chart Elements
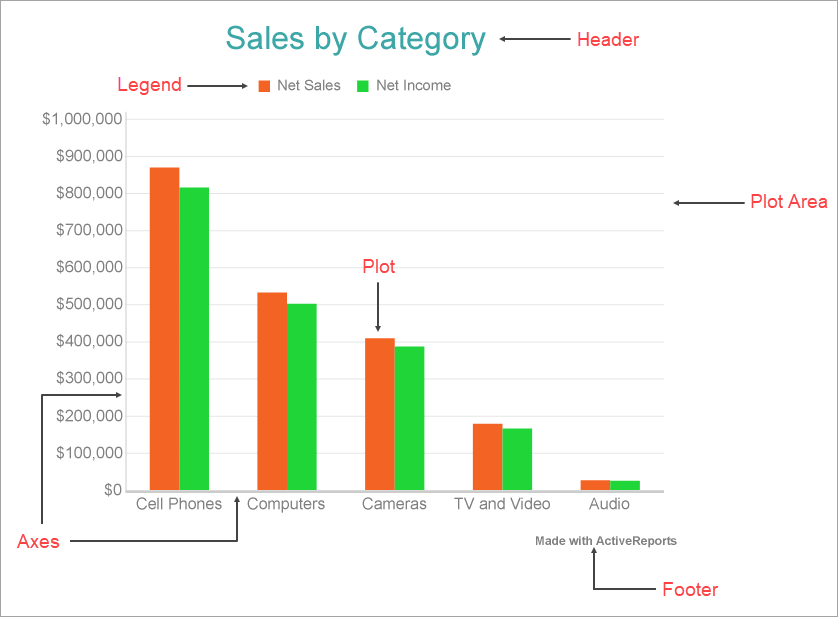
The below image illustrates the elements that make up the Chart data region. These elements help you analyze the visual information and interpret numerical and relational data in a chart.
You can view all the chart elements in the Report Explorer and access properties through the Chart Smart Panels and Properties panel.
Plot Area
The plot area is the area of the chart where the data is plotted graphically. It also includes the chart axes and legend.
Plot
The plot is where the actual chart is configured and converted to visual attributes, that is, graphs. It also includes other configuration settings like adding Trendlines, setting clipping mode, offset, etc. For more information, see the Plots topic.
Axes
Typically, a chart consists of two axes that are used to plot the data - vertical axis (also known as Y-axis) and horizontal axis (also known as X-axis). You can change the axis type, hide the axis label or title, customize the line appearance, etc. For more information, see the Axes topic.
Legend
The legend serves as a key to the specific colors or patterns being used to show series values in the chart. For more information, see the Legends topic.
Header
The chart header is used to display a title for the chart. The chart header appears above the plot area. Use the header settings to control the text formatting, padding, background color, alignment, etc. for a chart header.
Footer
The chart footer is used to add a footer for the chart. The chart footer is displayed below the plot area. Use the footer settings to control the text formatting, padding, background color, alignment, etc. for a chart footer.
Supported Chart Types
Following is the list of supported chart types in Page/RDLX reports. Each of these are discussed under Plots topic.
- Column and Bar Charts
- Area Chart
- Line Chart
- Pie and Doughnut Charts
- Scatter and Bubble Charts
- Radar Scatter and Radial Bubble Charts
- Radar Line Chart
- Radar Area Chart
- Spiral Chart
- Polar Chart
- Gantt Chart
- Funnel and Pyramid Charts
- Candlestick Chart
- High Low Close Chart
- High Low Open Close Chart
- Range Charts
- Gauge Chart