
- Introduction
- Report Readers
-
Report Authors
- Standalone Designer
- WebDesigner
- Report Types
-
Report Controls
-
Report Controls in Page/RDLX Report
- BandedList
- Barcode
- Bullet
-
Chart
- Chart Wizard
- Chart Smart Panels and Adorners
-
Plots
- Column and Bar Charts
- Area Chart
- Line Chart
- Pie and Doughnut Charts
- Scatter and Bubble Charts
- Radar Scatter and Radar Bubble Charts
- Radar Line Chart
- Radar Area Chart
- Spiral Chart
- Polar Chart
- Gantt Chart
- Funnel and Pyramid Charts
- Candlestick Chart
- High Low Close Chart
- High Low Open Close Chart
- Range Charts
- Gauge Chart
- Axes
- Legends
- Customize Chart Appearance
- Trendlines
- Classic Chart
- CheckBox
- Container
- ContentPlaceHolder (RDLX Master Report)
- FormattedText
- Image
- InputField
- Line
- List
- Map
- Matrix
- Overflow Placeholder (Page report only)
- Shape
- Sparkline
- Subreport
- Table
- Table of Contents
- Tablix
- TextBox
- Report Controls in Section Report
-
Report Controls in Page/RDLX Report
- Report Wizard
- Data Binding
- Design Reports
- DevOps
- Developers
- Samples
- Troubleshooting
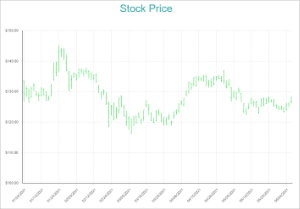
High Low Open Close Chart
HighLowOpenClose charts help to portray the price movements of a security, currency, or derivative over time with clarity. Though these are quite similar to the candlestick charts, a striking feature of the HighLowOpenClose charts is that they show the opening values using lines to the left, and closing values using lines to the right. The vertical line size is determined by the High and Low values. A suitable example for the HighLowOpenClose plot type is the movement of the stock price of a virtual company.
High Low Open Close Chart