The Radar area plot arranges categories on the circumference of a circle and connects the corresponding points with straight lines. The data values are plotted radially and are connected with straight lines resulting in a polygon shape. Radar Area plots are generally used to display ordinal variables across different category ranges.
A single value radar area chart shows measurements of one variable.

Radar Area Plot with Single Value
A multiple values radar chart lets you split data values into subcategories for finer analysis. The Create Radar Area Chart with Multiple Values walkthrough showcases the average movie budget in a country for different movie genres.
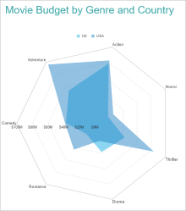
Radar Area Plot with Multiple Values