
- Introduction
- Report Readers
-
Report Authors
- Standalone Designer
- WebDesigner
- Report Types
- Report Controls
- Report Wizard
- Data Binding
-
Design Reports
-
Design Page/RDLX Reports
- Layout
- Report Dialog
- Master Report (RDLX Report)
- Layers
- Expressions
- Data Visualizers
- Filters
- Groups
- Interactivity
- Scripts
- Report Appearance
- Tutorials: Report Controls in Page/RDLX Reports
-
Tutorials: Page/RDLX Report Scenarios
- Create RDLX Dashboard Report
- Create Multi-Column Layout (or Columnar report)
- Create Top N Report
- Create a Red Negatives or a Green Bar Report
- Apply Theme at Runtime Using Dynamic Expression
- Add Page Numbering
- Show Row Number in Tablix and Table
- Link Multiple Datasets to Same Data Region
- Localize RDLX Report Content
- Design Section Reports
-
Design Page/RDLX Reports
- DevOps
- Developers
- Samples
- Troubleshooting
Create a Red Negatives or a Green Bar Report
A Red Negatives report is a report type that shows negative values in red color such that these values meet the requirements set in a conditional expression. A Green Bar report can be similarly created by alternating the background color of a data region like a Table using conditional formatting.
The following steps show how to generate a report with negative values in red negatives.
Create a new Page/RDLX report and bind the data to 'reels.db'. See Configure ActiveReports using Config file for more information.
In the DataSet dialog that appears, go to the Query page and enter a query in the Query textbox in the following format:
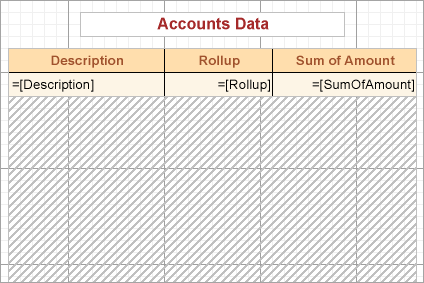
SELECT AccountsChart.AccountId, AccountsChart.ParentId, AccountsChart.Description, AccountsChart.Rollup, Expenses.ExpenseDate, Sum(Expenses.Amount) AS SumOfAmount
FROM AccountsChart LEFT JOIN Expenses ON AccountsChart.AccountId=Expenses.AccountID
GROUP BY AccountsChart.AccountId, AccountsChart.ParentId, AccountsChart.Description, AccountsChart.Rollup, Expenses.ExpenseDate
ORDER BY Expenses.ExpenseDate, AccountsChart.AccountId;
From the Toolbox, drag and drop a Table data region onto the design surface.
In the Report Explorer, expand the DataSet node and drag and drop following fields inside the cells of the details row:
[Description]
[Rollup]
[SumOfAmount]
In the same table, select any cell (Textbox) that displays integer values, for example [Rollup].
In the Properties panel, set the following expression in the Color property:
=iif(Fields!Rollup.Value < 0, "Red", "Black")
Note: In general, the expression will be =iif(Fields!FieldName.Value < 0, "Red", "Black") where FieldName refers to field that the textbox contains (of integer type).
To avoid repetition of [Description] in detail row, apply detail grouping based on [Description]field. See Detail Grouping for more information.
Drag-drop a Textbox control for the report heading.
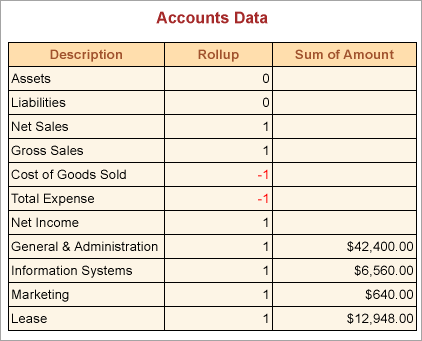
Preview the report.
The following image illustrates a report that contains negative values in red:
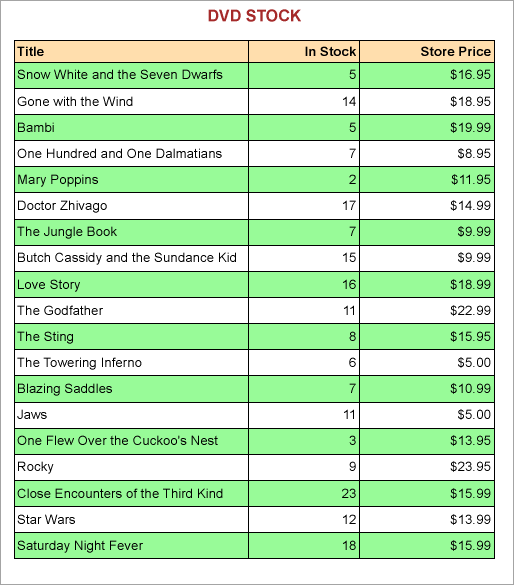
For a green bar report, click the row handle to the left of the detail row of a Table data region and set the following expression in the BackgroundColor property:
=iif(RowNumber(Nothing) Mod 2, "PaleGreen", "White")On previewing the report, you will notice that every alternate detail the report displays has a green background as depicted by the following image.
Note that with Detail Grouping applied on a table, the background color will not appear as expected.