
Filters
In Page and RDLX reports, ActiveReports allows you to set filters on a large set of data that has already been retrieved from the data source and use them with datasets or data regions to limit the information you want to display on your report.
Although not as efficient performance-wise as query parameters which filter data at the source, there are still scenarios which demand filters. The obvious case is when the data source does not support query parameters. Another case for using filters is when users who require different sets of data view in the same report.
You can set filters on a Filters page similar to the one in the following image.
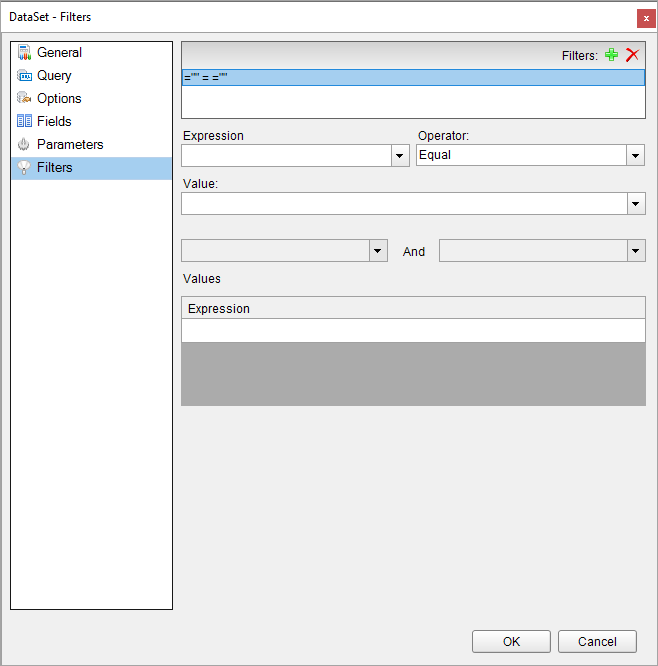
A filter consists of the three major elements:
- Expression: Type or use the expression editor to provide the expression on which to filter data. See Expressions page on more information.
- Operator: Select the operator to compare the expression results with the Value.
- Value: Enter the value with which to compare the expression results.
For example, in the filter =Fields!YearReleased.Value = 1997 applied on a dataset from the Movies table of the Reels.db database, =Fields!YearReleased.Value is set under expression, = is the operator and 1997 is the value on which filter is set.
You can also use multiple values with the In and Between operators. Two fields with an And in the middle appear for the Between operator, and another Expression field is available at the bottom of the Filters page or tab for the In operator. The following table lists all available filtering operators.
Filtering Operators
| Filter | Description |
|---|---|
| Equal | Select this operator if you want to choose data for which the value on the left is equal to the value on the right. |
| Like | Select this operator if you want to choose data for which the value on the left is similar to the value on the right. See the MSDN Web site for more information on the Like operator. |
| NotEqual | Select this operator if you want to choose data for which the value on the left is not equal to the value on the right. |
| GreaterThan | Select this operator if you want to choose data for which the value on the left is greater than the value on the right. |
| GreaterThanOrEqual | Select this operator if you want to choose data for which the value on the left is greater than or equal to the value on the right. |
| LessThan | Select this operator if you want to choose data for which the value on the left is less than the value on the right. |
| LessThanOrEqual | Select this operator if you want to choose data for which the value on the left is less than or equal to the value on the right. |
| TopN | Select this operator if you want to choose items from the value on the left which are the top number specified in the value on the right. |
| BottomN | Select this operator if you want to choose items from the value on the left which are the bottom number specified in the value on the right. |
| TopPercent | Select this operator if you want to choose items from the value on the left which are the top percent specified in the value on the right. |
| BottomPercent | Select this operator if you want to choose items from the value on the left which are the bottom percent specified in the value on the right. |
| In | Select this operator if you want to choose items from the value on the left which are in the array of values on the right. This operator enables the Values list at the bottom of the Filters page. |
| Between | Select this operator if you want to choose items from the value on the left which fall between pair of values you specify on the right. This operator enables two Value boxes instead of one. |
You can set filters on the following:
- DataSet
- Data Region
- Groups in a Data Region
Set a Filter on a DataSet
When you set a filter on a dataset, any control you add to the design surface can use this filtered data. Let us elaborate the dataset filtering using the 'Movie' table from Reels.db data source on GitHub.
- In the Report Explorer, right-click the DataSet node and select Edit.
- In the DataSet dialog that appears, go to the Filters page and click the Add (+) icon to add a new filter for the data set. By default, an empty filter expression gets added to the filter list.
- Under Expression, enter an expression or use the Expression Editor to provide the expression on which to filter data. For example, =Fields!YearReleased.Value
- Under Operator, select an operator from the list to decide how to compare the 'Expression' with the 'Value'. For example, set a GreaterThan operator on the expression above.
- Under Value, enter a value or set an expression using the Expression Editor with which to compare the expression results. For example, 2003 to represent the year 2003. The resultant filter looks as follows.
=Fields!YearReleased.Value > 2003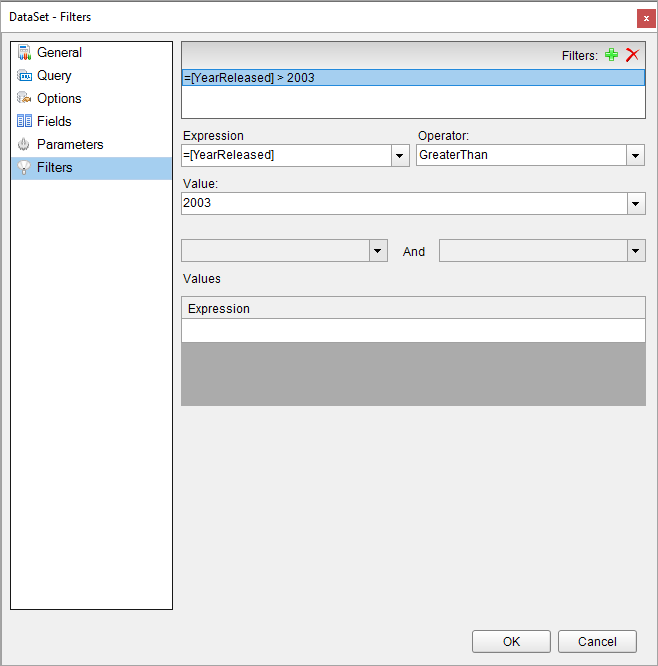
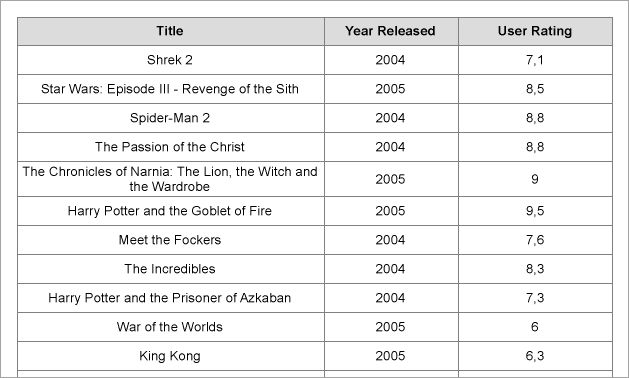
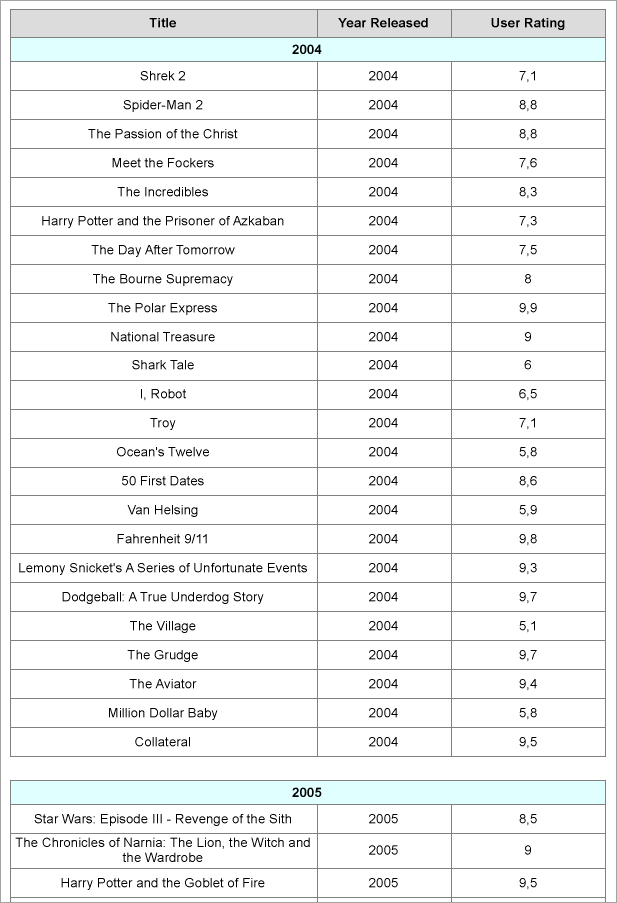
- Now that the dataset filter is configured, to view the filtered data, let us add a Table data region and drag-drop fields such as 'Title', 'Year Released', and 'User Rating' on its Details row.
- Preview the report. You see that the table displays the records only for the years where 'Year Released' is greater than '2003'.
Set a Filter in a Data Region
When you set a filter in a data region, you can limit the amount of data available for use inside that data region. The following steps are applicable to Table and List data regions, and the data regions are bound to the 'Movie' table from Reels.db data source on data source on GitHub.
With the data region selected on the report, under the Properties window, click the Property dialog link to open the data region dialog.
In the data region dialog that appears, select the Filters page and click the Add (+) icon to add a new filter for the data region. By default, an empty filter expression gets added to the filter list.
Under Expression, enter an expression or use the Expression Editor to provide the expression on which to filter data. For example,
=Fields!UserRating.ValueUnder Operator, select an operator from the list to decide how to compare the Expression with the Value. For example, set a LessThan operator on the Expression above.
Under Value, enter a value or set an expression using the Expression Editor with which to compare the expression results. For example, 6 to represent the Rating 6. The resultant filter looks like the following.
=Fields!UserRating.Value < 6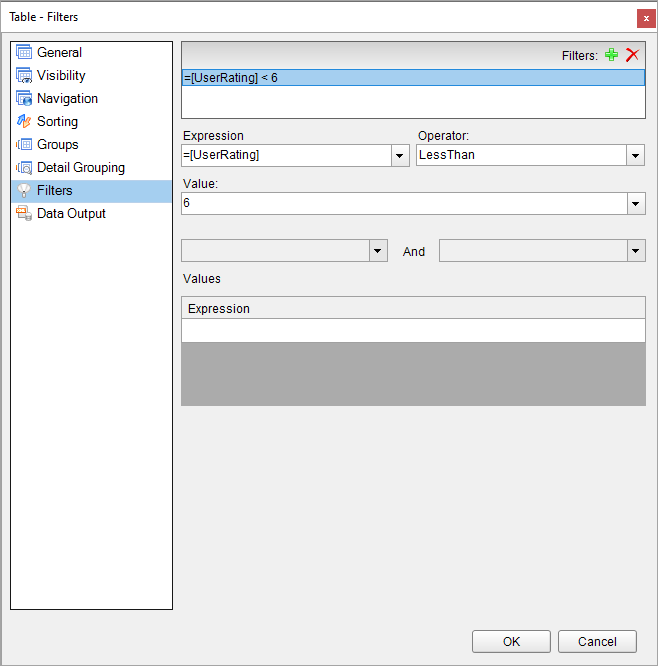
Preview the report to get the filtered data.
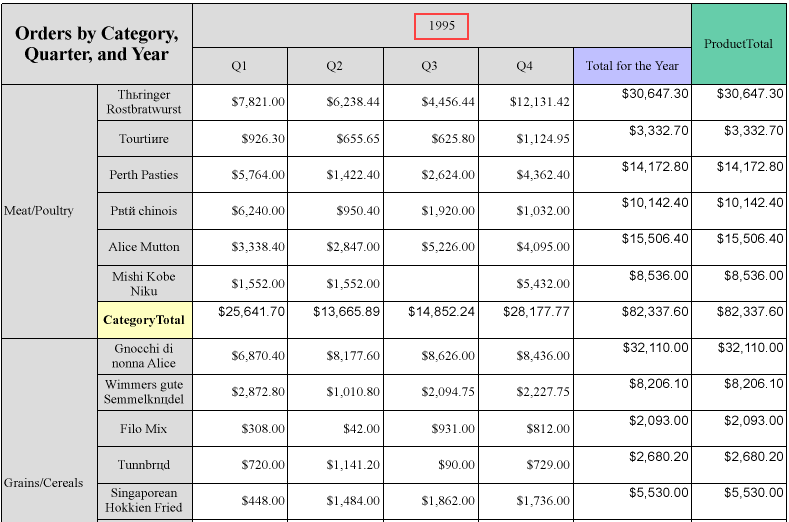
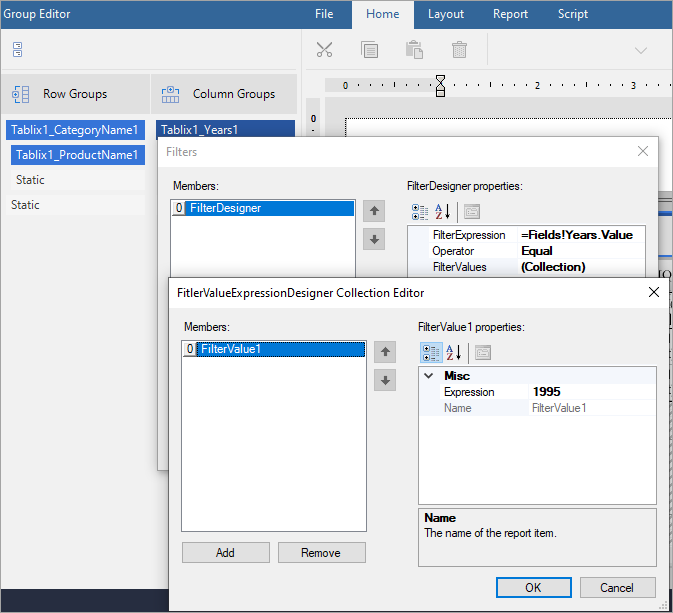
For Tablix data region, follow these steps to add a filter. Let us demonstrate applying a filter on the Tablix data region using the 'TablixSample.rdlx' report that you can find in Samples19 folder on GitHub. In this report, we will apply filter such that only the records for the year '1995' are shown.
- With the Tablix data region selected, go to the Filters property in the Properties window.
- Click the ellipses next to '(Collection)' to open the Filter dialog.
- Click Add to add a filter, and in the FilterDesigner properties, enter the FilterExpression to =Fields!Years.Value and Operator to Equal.
- In the FilterValues property, click the ellipses next to '(Collection)' to open the FilterValueExpressionDesigner Collection Editor.
- Click Add to add the filter values and set the filter values properties.
- In Expression, specify the value to which the filter expression should be evaluated, in our case, set Expression to '1995'.
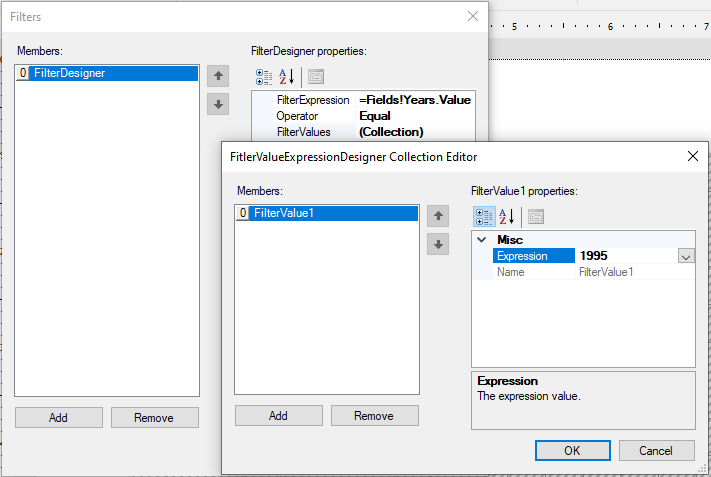
- Click OK to complete setting up the filter value and then again to finish adding the filter.
Set a Filter on Groups in a Data Region
You can also set filters on grouped data in a data region. The following example uses the Table data region to show filtering on groups.
- In the report, set grouping on a data region. For example, on a Table data region, set grouping on the =Fields!YearReleased.Value field.
- With the data region selected on the report, under the Properties window, click the Property dialog link to open the data region dialog.
- In the Table dialog, go to the Groups tab and select the Group.
- After selecting the group, go to the Filters tab and click the Add (+) icon to add a new filter. By default, an empty filter expression gets added to the filter list.
- Under Expression, enter an expression or use the Expression Editor to provide the expression on which to filter data. For example, =Fields!YearReleased.Value
- Under Operator, select an operator from the list to decide how to compare the Expression with the Value. For example, GreaterThan operator set on the Expression above.
- Under Value, enter a value or set an expression using the Expression Editor with which to compare the expression results. For example, 2005 to represent the year 2005. The resultant filter looks like the following.
=Fields!YearReleased.Value > 2005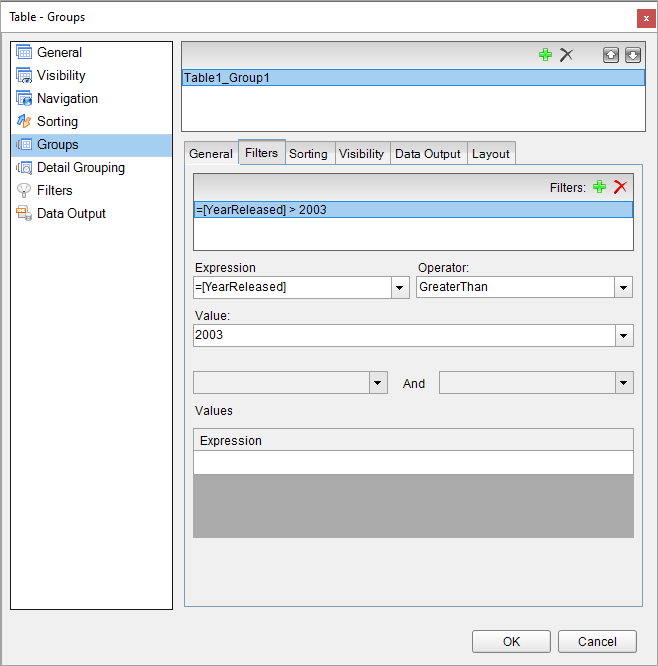
- Preview the report to get the filtered data.
For Tablix data region, follow these steps to add a filter. Let us demonstrate applying a filter on the Tablix data region using the 'TablixSample.rdlx' report that you can find in Samples19 folder on GitHub.
- With the Tablix data region selected, go to the Filters property in the Properties window.
- Click the ellipses next to '(Collection)' to open the Filter dialog.
- Click Add to add a filter, and in the FilterDesigner properties, enter the FilterExpression to =Fields!Years.Value and Operator to Equal.
- In the FilterValues property, click the ellipses next to '(Collection)' to open the FilterValueExpressionDesigner Collection Editor.
- Click Add to add the filter values and set the filter values properties.
- In Expression, specify the value to which the filter expression should be evaluated, in our case, set Expression to '1995'.
- Click OK to complete setting up the filter value and then again to finish adding the filter.