
- Introduction
- Report Readers
-
Report Authors
- Standalone Designer
- WebDesigner
- Report Types
- Report Controls
- Report Wizard
- Data Binding
- Design Reports
- DevOps
- Developers
- Samples
- Troubleshooting
Query Builder in Microsoft SQL Client and OLEDB Providers
In a Page report or an RDLX report, you can use the Visual Query Designer for creating queries in Microsoft SQL Client and OLEDB data providers. The Visual Query Designer is a graphical interface that simplifies data binding by allowing users to interactively build queries and view the results. With its interactive interface, users who are unfamiliar with SQL can easily design, edit, preview, and save queries.
Visual Query Designer supports the following SQL capabilities, such as custom expressions, select fields and tables, sort and filter data, join tables, apply group and aggregate functions to fields, and set aliases for the selected fields and tables.
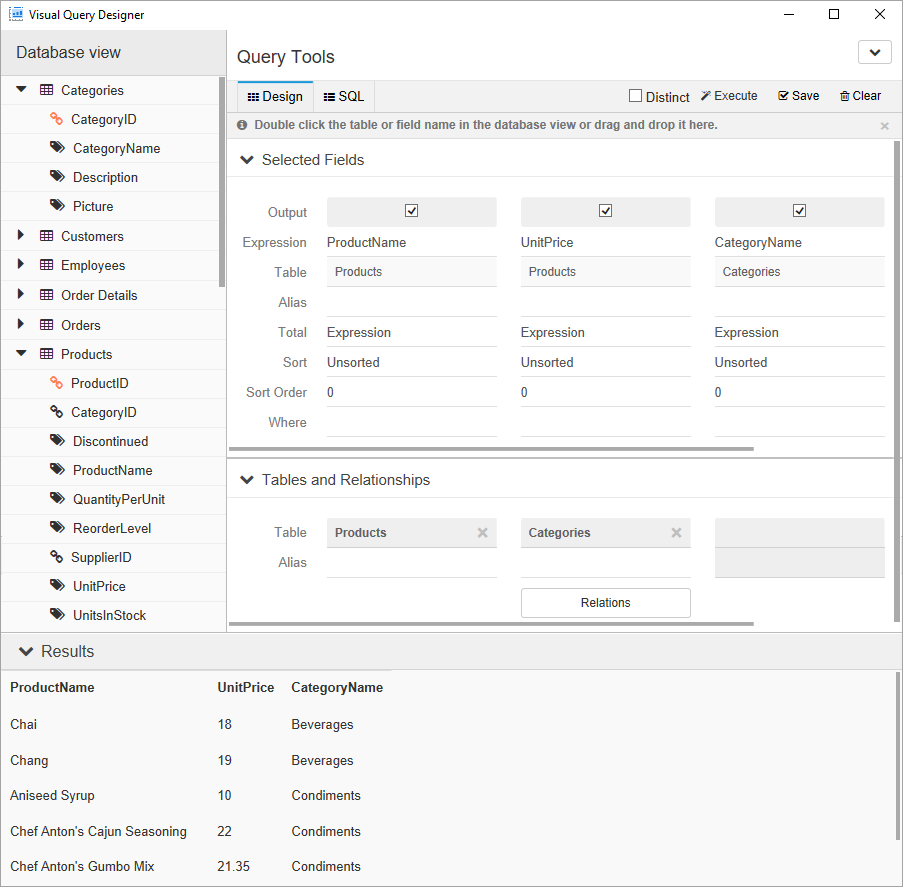
Interface Elements
Database view
The Database view appears on the left of the query builder. It displays the structure of the database including namespaces, tables, views, and columns based on the data source configuration details specified earlier. You can drag and drop or double click the elements in the Database view to add them to the Design tab. Alternatively, you can double-click the crossed arrow icon on the right-hand side of each element in the Database view to add it to the Design tab. This is the first step in query building through the Visual Query Designer. A SQL query is generated as you add the database elements to the Design tab.
Query Tools
The Visual Query Designer provides several tools to generate a query. The Query Tools appear on the right of the query builder and is broadly classified into the following three major areas:
Design tab
The Design tab is the area of the Visual Query Designer where you set up queries. It provides a visual interface for the SQL query you want to generate.
The Design tab consists of two panels: Selected Fields and Table and Relationships.
The Selected Fields panel displays the fields, tables, or any other element selected from the Database view. Each field in this panel has its own set of editable options.
| Option | Description |
|---|---|
| Output | Determines whether the field will be included in the result set. By default, this checkbox is selected when a field is added to the Selected Fields panel. You can clear this checkbox if you do not want the field to be displayed in the Results panel. |
| Table | Displays the name of the table the selected field belongs to. |
| Alias | Allows the user to provide an alternative name for the field. |
| Total | Applies grouping or aggregates on a field. Total (expression) is used to perform a calculation, retrieve the value of a control, define regulations, create calculated fields, and define a group level for a report. * Expression - Allows the selection of fields from a table. Custom expressions can also be specified here. * GroupBy - Groups data based on the selected field. * Count - Returns the number of items in a group. Implements the SQL COUNT aggregate. * Avg - Returns the average of values in a group. Implements the SQL AVG aggregate. * Sum - Returns the sum of all the values in a group. Implements the SQL SUM aggregate. * Min - Returns the minimum value in a group. Implements the SQL MIN aggregate. * Max - Returns the maximum value in a group. Implements the SQL MAX aggregate. * StDev - Returns the statistical standard deviation of all the values in a group. Implements the SQL STDEV aggregate. * Var - Returns the statistical variance of all values in the group. Implements the SQL VAR aggregate. |
| Sort | Arranges data in a prescribed sequence i.e. in Ascending or Descending order. By default, this option is set to Unsorted. |
| Sort Order | Allows the user to set the order of sorting in case multiple fields are to be sorted. |
| Where | Allows the user to set a filtering condition for the column data. The WHERE clause can be used when you want to fetch any specific data from a table omitting other unrelated data. |
type=note
Note: If you want to delete a field in the Selected Fields panel, hover the mouse cursor over the field and click the Delete button.
The Tables and Relationships panel displays a list of all the tables with fields in the Selected Fields panel. The Relations button at the bottom of the related table's name shows the relationship between two or more tables when associating rows of one table with the rows of another.
You can set up these relationships between tables using SQL Joins like Inner Join, Left Join, and Right Join in the Visual Query Designer. The relationship you set up between the data in these tables determines how the data appears in the result set.
Inner Join (simple join): It matches rows from table1 with rows in table2, and allows the user to retrieve rows that show a relationship in both the tables. Inner join produces a set of data that matches both table1 and table2.
SELECT table1_name.column_name FROM table1_name INNER JOIN table2_name ON table1_name.column_name = table2_name.column_nameLeft Outer Join (left join) - It selects rows that match from both the left and right tables, plus all the rows from the left table (table1). This means only those rows from table2 that intersect with table1 appear in the result set.
SELECT table1_name.column_name FROM table1_name LEFT [OUTER] JOIN table2_name ON table1_name.column_name = table2_name.column_nameRight Outer Join (right join) - Right outer join allows users to select rows that match from both the left and right tables, plus all the rows from the right table (table2). This means that only those rows from table1 that intersect with table2 appear in the result set.
SELECT table1_name.column_name FROM table1_name RIGHT [OUTER] JOIN table2_name ON table1_name.column_name = table2_name.column_name
Use the Tables relations dialog box to set up a relationship between two different tables with at least one common field (or column). This dialog box automatically appears when you add another field from a different table in the Database view tab to the Selected Fields panel. Make sure that at least one field between these two tables matches. In other words, the second table should contain a foreign key corresponding to which the first table contains rows with a same primary key.
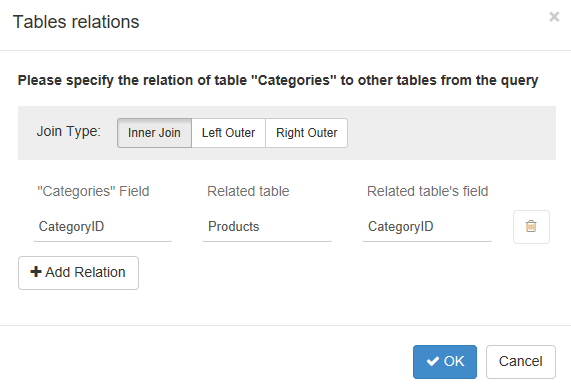
The Tables relations dialog box provides the following options.
| Option | Description |
|---|---|
| Join Type | Enables users to specify the join type for joining two tables. You can set the join type to Inner Join, Left Outer Join, and Right Outer Join. |
| <Table Name> Field | Displays the name of the field that is common between tables i.e. the foreign key name in the second table. Example: "Products" Field contains the 'Category ID' field in the image above. |
| Related table | Displays the name of the table to which the relationship has been set up. |
| Related table's field | Displays the name of the field from the table to which the relationship has been set up. |
| Delete | Deletes the currently added relation in the dialog. |
| Add Relation | Allows users to add another relationship to the table. |
The Query Tools section also has a drop-down on the top right corner with the following two options.
- Toggle Panels: Allows users to expand or collapse the Selected Fields and the Tables and Relationships panel.
- Show Hints: Enables users to show or hide hints on how to use the Visual Query Designer effectively. For example, a hint is displayed on top of the Selected Fields panel saying - Double click the table or field name in the database view or drag and drop it here.
SQL tab
The SQL tab automatically generates an SQL query based on the options specified in the Designer tab. Here, you can also manually edit an existing query or create a new query.
Toolbar buttons
The options available through the toolbar buttons are elaborated in this table.
| Option | Description |
|---|---|
| Distinct | Allows users to remove duplicate values from the result set of a SELECT statement. You can check this option to display only distinct values. |
| Execute | Allows users to execute their query and view the result in Results panel. |
| Save | Allows users to save the query to a DataSet dialog. |
| Clear | Allows users to clear all the panels in the Visual Query Designer and the SQL tab along with it. |
Results panel
Displays the result of the query set in the Visual Query Designer.
This panel is populated when you click the Execute button on the Visual Query Designer toolbar after adding the required fields or tables in the Selected Fields panel.
Limitations
Following are few limitations of Visual Query Designer
- Unions, nested queries, and stored procedures are not supported in the Design tab.
- Crosses, full joins, provider-specific joins, and other SQL-specific implementation capabilities are not supported in the Design tab.
Designing queries in Visual Query Designer
Follow the below steps to build a query in the Visual Query Designer.
In the Report Explorer, right-click an existing data source and select the Add Data Set option.
In the DataSet dialog box that appears, select the General page and enter the name of the dataset. By default, the dataset name is set to DataSet1. This name appears as a child node to the Data Source node in the Report Explorer.
Navigate to the Query tab and click the Edit with the Visual Query Designer icon
 in the DataSet dialog box.
The following sections describe the operations that you can perform in a Visual Query Designer.
Add a field or table
This is the primary step while designing queries in the query designer. There are two ways to add fields in the query.
- Double-click the field name or table name in the Database view.
- Drag the desired field or table from the Database view to the Selected Fields panel.
> !type=note > > **Note**: If you add a table to the **Selected Fields** panel, all the fields in that table are added to the query.//Query for adding fields SELECT table_name.field_name FROM table_name //Query for adding a table SELECT * FROM table_nameSpecify an alias for a field
Alias is a temporary name given to a field for the duration of a query. You can specify an alias to make the field name more readable.
- Select the desired field in the Selected Fields panel.
- Go to the Alias option and enter the alias for the field in the space provided.
SELECT table_name.field_name AS alias_name FROM table_nameSpecify an alias for a table
Alias is a temporary name given to a table for the duration of a query. You can specify an alias to make the table name more readable.
- Select the desired table in the Tables and Relationships panel.
- Go to the Alias option and enter the alias for the table in the space provided.
SELECT * from table_name AS alias_nameJoin tables
If you want to combine rows from two or more tables, you need to join the tables based on a logical relationship between them. A Tables relation dialog box automatically appears when you add a field belonging to a different table. Use this dialog box to specify the relationships between the two tables.
- Drag and drop a field from a table in the Database view to the Selection Fields panel.
- Add another field from a different table in the Database view to the Selected Fields panel. The Tables relations dialog automatically pops up on the screen.
Make sure that at least one field between these two tables matches, i.e., the second table should contain a foreign key corresponding to which the first table contains rows with a same primary key. - Specify the Join Type you want to set for combining the two tables by clicking the Inner Join, Left Outer Join, or Right Outer Join button.
The dialog box automatically picks the common field name present in both the tables, related table name, and related field name based on the fields selection. However, you can modify these details by clicking the associated drop-down arrows. - Click OK to save the changes.
//Query for inner join
SELECT table1_name.column_name FROM table1_name INNER JOIN table2_name ON table1_name.column_name = table2_name.column_name

//Query for left outer join
SELECT table1_name.column_name FROM table1_name LEFT [OUTER] JOIN table2_name ON table1_name.column_name = table2_name.column_name

//Query for right outer join
SELECT table1_name.column_name FROM table1_name RIGHT [OUTER] JOIN table2_name ON table1_name.column_name = table2_name.column_name
Delete a field
When you delete a field from a query, the field remains in the database but is no longer used in the query.
- In the Selected Fields panel, hover your mouse over the field to display the Delete
 icon.
icon. - Click the Delete icon to delete the field.
Delete a table
When you delete a table from a query, the table remains in the database but is no longer used in the query.
- In the Tables and Relationships panel, select the table you want to delete.
- Click the Close
 icon. This will delete the selected table from the query.
Sort data
You can sort the fetched data in either ascending or descending order based on one or more fields in the table(s).
- Select the desired field in the Selected Fields panel.
- Go to the Sort option and choose one of the following options - Ascending or Descending. This will sort the field values in the chosen order.
SELECT * FROM table_name ORDER BY field_name ASC|DSCFilter data
Applying filters allows you to fetch a specific data from a table that matches a certain criteria
- Select the desired field in the Selected Fields panel.
- Go to the Where option and enter the filter criteria with an required operator (like '=', '>', '<', '<>', etc). This will filter the rows based on the specified filter condition.
If you want to filter the data based on a parameter value instead of a constant value, set the Where field to '=@<field name>'. This will generate a parameterized query that generally prompts the user to enter a value before the query is executed, to determine the type of data to be displayed in the result set.
SELECT * FROM table_name where [CONDITION]Apply aggregate functions and grouping
You can group data on a field and create an aggregate query that involves a function such as Sum or Avg in the Visual Query Designer.
- Select the desired field in the Selected Fields panel on which you want to apply grouping or aggregate function.
- Go to the Total option and choose one of the following options from the drop-down - Expression, GroupBy, Count, Avg, Sum, Min, Max, StDev, and Var.
//Query for grouping data
SELECT * FROM table_name WHERE [CONDITION] GROUP BY table_name.field_name

//Query for aggregate functions
SELECT aggregate_function(table_name.field_name) FROM table_name WHERE [CONDITION]
Preview the query using the Execute button in the Toolbar.
You can save the query in the DataSet dialog box by clicking the Save button next to the Execute button.Click the Validate DataSet
 icon to verify the query in the DataSet dialog box. Go to the Fields page to view the dataset fields fetched from the generated query.
Click the OK button to close the DataSet dialog box.