
- Introduction
- Report Readers
-
Report Authors
- Standalone Designer
- WebDesigner
- Report Types
-
Report Controls
- Report Controls in Page/RDLX Report
- Report Controls in Section Report
- Report Wizard
- Data Binding
- Design Reports
- DevOps
- Developers
- Samples
- Troubleshooting
Customize Chart Appearance
You can customize the chart appearance by changing these target properties of the chart plot.
Custom Labels
Set Custom Labels for X-Axis
Let us add custom labels in the following chart, where the default labels for the X-Axis show Ship Names since the Category Groups area is bound to [ShipName].
The chart binds to the 'Invoices' table of the Nwind.db. See Configure ActiveReports using Config file for more information.
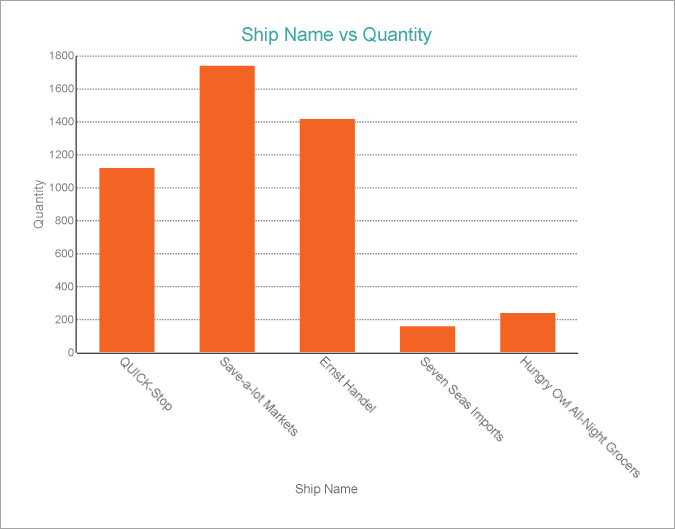
You can customize the X-Axis labels of the above chart as follows to show 'City' along with 'Ship Name'.
From the Category Groups area, select the field, [ShipName], which is displayed along the X-Axis.
In the Properties window, go to Label property and set it to the following expression:
=Fields!ShipName.Value + " , " + Fields!City.Value
Now select the X Axis and go to Labels > LabelsAngle property and set it to say, '45' degrees.
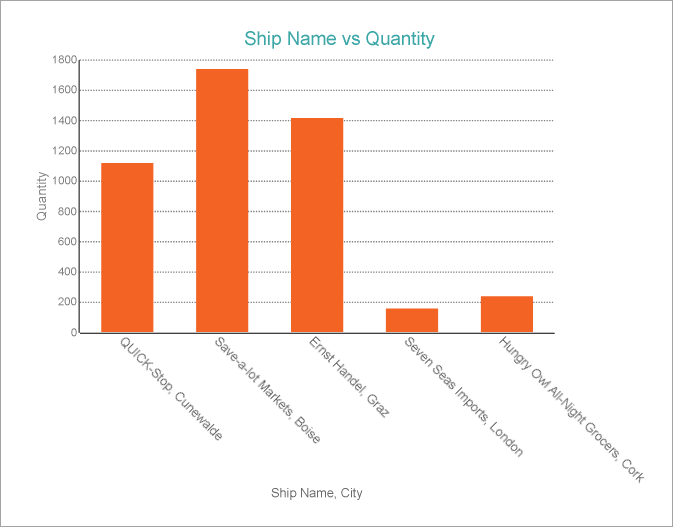
Go to Title > Title and set it to 'Ship Name, City', to display this text as the X-Axis's title.
Preview the report.
The below image shows how the X-Axis labels show customized labels.
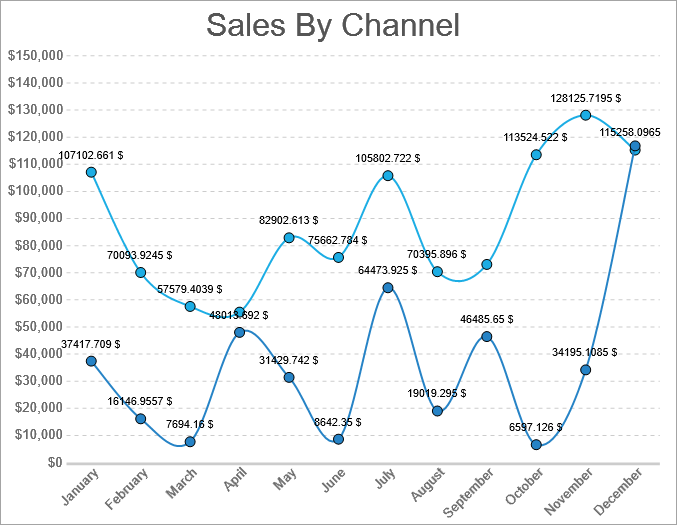
Set Custom Labels for Chart Data Series
Let us add custom labels for the chart data series in the chart created in the Create Multiple Line Chart tutorial by following the below steps.
From the Chart Data area, select the [Sales Amount] field.
From the Properties panel, go to Appearance > Labels > Value property and set the property to the following expression:
=Sum(Fields!SalesAmount.Value) & " $"
Preview the report.
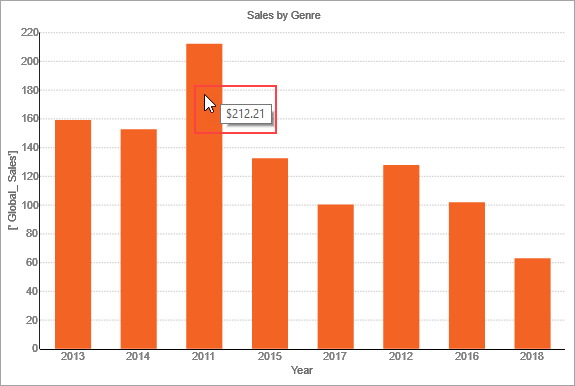
ToolTips
To add a tooltip in a chart with ['Global_Sales'] as chart data, displayed along the Y-Axis, follow the below steps:
From the Chart Data area, select ['Global_Sales'].
Set DataToolTip > Value and add the expression to display the field; e.g.
=Sum(Fields.Item("['Global_Sales']").Value)
Set the DataToolTip > Format to 'c'.
Preview the report.
Conditional Chart Formatting
Select the series data and use expressions as follows in the corresponding properties to see the effect. Refer to the Create Clustered Column Chart tutorial, with only one series for simplicity.
FillColor
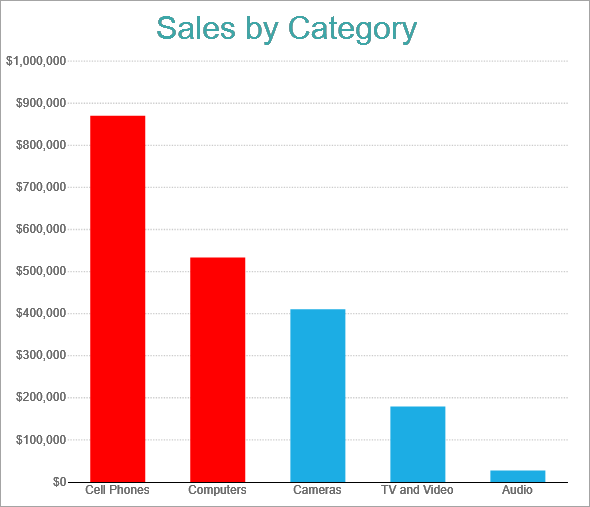
Select the Chart Data series (here [Net Sales]) and from the Properties panel, set the expression of FillColor property to the following:
IIF(Sum(Fields.Item("Net Sales").Value)>450000,"Red")LineColor/LineStyle/LineWidth
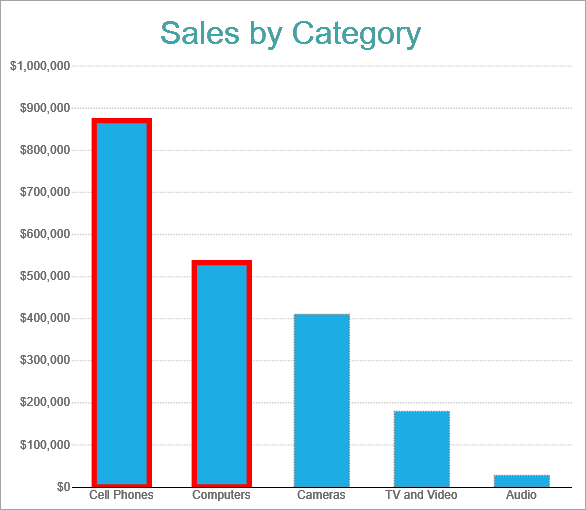
Select the Chart Data series (here [Net Sales]) and from the Properties panel, set the expression of LineColor, LineStyle, and LineWidth properties respectively to the following:
=IIF(Sum(Fields.Item("Net Sales").Value)>450000,"Red","Grey")=IIF(Sum(Fields.Item("Net Sales").Value)>450000,"Double","Dotted")=IIF(Sum(Fields.Item("Net Sales").Value)>450000,"4pt","1pt")For charts such as Line, Radar Line, which are composed of markers or data point symbols, have the properties that can be set for conditional formatting. For example, in Create Single Line Chart tutorial, we can highlight the markers as shown.
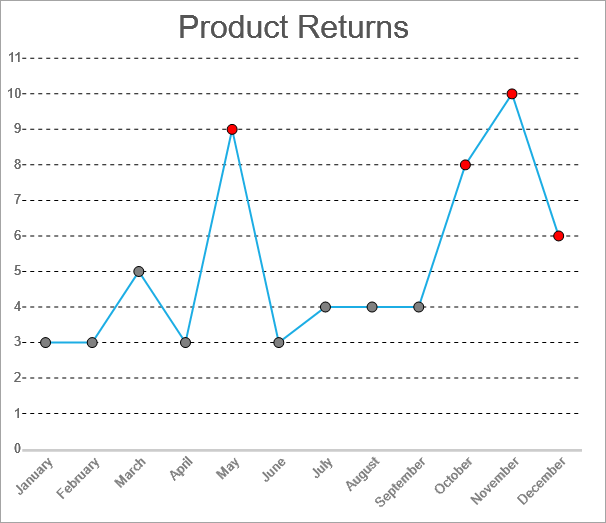
To do so, with the Chart Data series (here [Return Quantity]) selected, from the Properties panel, go to Marker > BackgroundColor. and set the expression to the following.
=IIF(Sum(Fields!ReturnQuantity.Value)>5,"Red","Grey")Similarly, expressions for Marker border settings > LineColor, LineStyle, and Width can be set.