
- Introduction
- Report Readers
-
Report Authors
- Standalone Designer
- WebDesigner
- Report Types
- Report Controls
- Report Wizard
- Data Binding
-
Design Reports
-
Design Page/RDLX Reports
- Layout
- Report Dialog
- Master Report (RDLX Report)
- Layers
- Expressions
- Data Visualizers
- Filters
- Groups
- Interactivity
- Scripts
- Report Appearance
-
Tutorials: Report Controls in Page/RDLX Reports
- TableofContent Control for Navigation
- BandedList Data Region for Free-form Bands
- Bullet Control to Visualize Sales against Target
- CheckBox Control
- OverflowPlaceholder Control for Columnar Reports
- InputField Control for Editable PDFs
- Line Control for Freehand Forms
- List Control for Hierarchical Relationships
- Table Data Region for a Tabular Report
- Shape Control for Enhanced Report Appearance
- Image Control
- Container Control for Enhanced Report Appearance
- FormattedText Control for Mail Merge
- Subreport Control for a Master-Detail Report
- Sparkline Control
- Tablix Data Region
- TextBox Control
- Map Data Region
- Tutorials: Page/RDLX Report Scenarios
- Design Section Reports
-
Design Page/RDLX Reports
- DevOps
- Developers
- Samples
- Troubleshooting
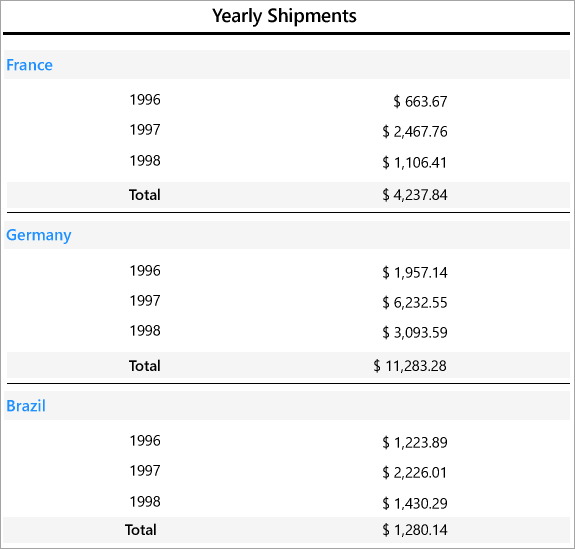
BandedList Data Region for Free-form Bands
Let us create a report that shows yearly shipments for each country. To display a summarized shipment value for each country and year, we will use BandedList data region and add groups. The report connects to the 'Orders' JSON data available here.
The final report will look as shown.
Create a Report
In the ActiveReports Designer, create a new RDLX report.
type=note
If you are creating a new report in the Visual Studio Integrated Designer, see Quick Start.
Bind Report to Data
As you create a new report, you can configure the report data connection in the Report Wizard. You can also access the Report Data Source dialog by right-clicking the Data Sources node in the Report Explorer and then selecting the Add Data Source option. See JSON for details.
- On the Choose Data Source Type screen of the wizard, select JSON and click Next.
- To specify JSON File Path, click the Browse button and navigate to the desired file on your system. This report uses the 'orders.json' sample data source that can be downloaded from the following URL:
https://demodata.mescius.io/northwind/odata/v1/Orders - Click the Next option and configure the dataset by adding a valid query. Enter OrderdsDataset into the Name field and select the node from the data tree in the Path section to generate the path. The resulting query is displayed in the Query field.
- Click Finish to successfully add the report with the JSON data source.
Design Report Layout
- Drag and drop the BandedList control onto the report's designer.
- With the BandedList control selected, click the Property dialog link to open the BandedList dialog.
- Go to the Groups page and click Add.
- Set the Group on Expression to =Fields!ShipCountry.Value.
This will ensure that the data in the banded list is grouped based on the [ShipCountry] field. - Again, click Add to insert another group.
- Set the Group on Expression to =Year(Fields!OrderDate.Value).
This will repeat the shipments by year for each country. - Click OK to close the dialog. Group Headers and a Group Footers are added.
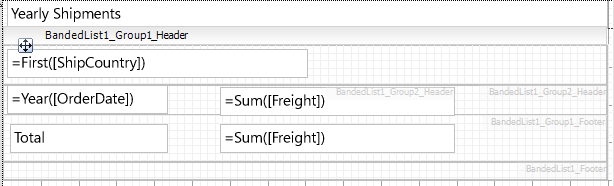
- From the dataset, drag the [ShipCountry] data field to the Group1 Header of the BandedList control.
- Drag and drop two Textbox controls onto the Group2 Header of the control and set their Value property as follows:
- TextBox1: =Year(Fields!OrderDate.Value)
- TextBox2: =Sum(Fields!Freight.Value)
- In the Properties pane, set the Format property for the [Freight] field to Currency.
- Again, drag and drop two Textbox controls onto the Group1 Footer of the control and set their Value property as follows:
- TextBox3: Total * TextBox4: =Sum(Fields!Freight.Value)
- To add the report title, drag and drop the TextBox control to the PageHeader section and set its Value property to 'Yearly Shipments'.
- Improve the appearance of the report and preview.