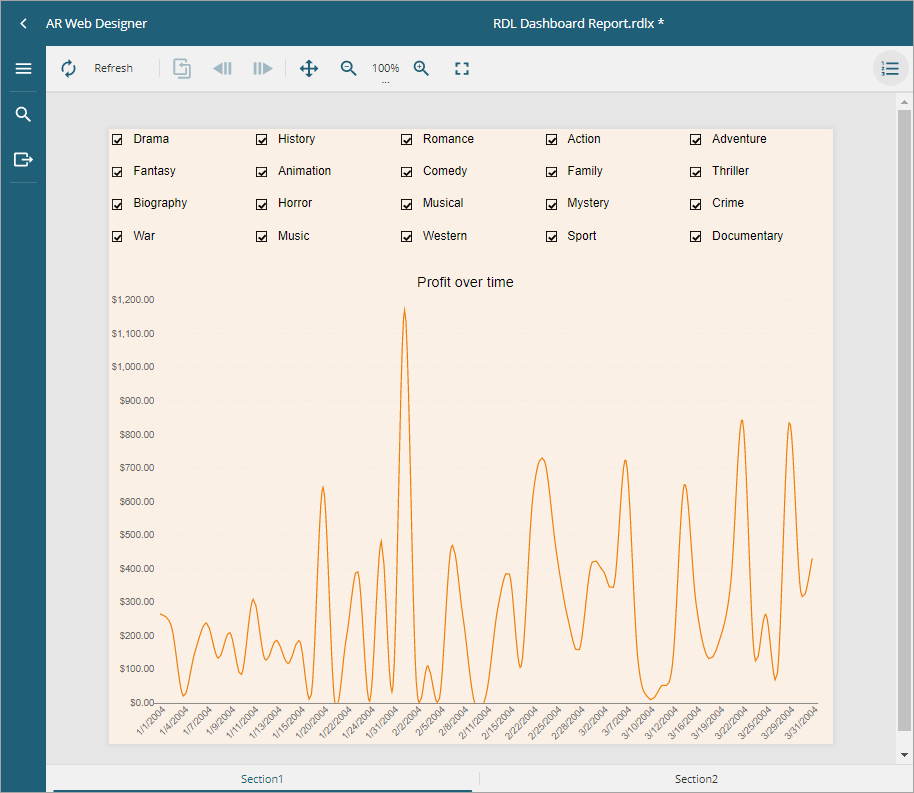
RDLX Dashboard Report

The RDLX Dashboard (.rdlx) report is the latest addition to the varied reports that you can design in ActiveReports. The RDLX Dashboard reports are best viewed in the JS Viewer.
Key Features
Manage Sections
RDLX Dashboard Reports can be multi-page like RDLX Report. With multiple pages or sections, you can make the dashboard report more informative with details spread across the pages. These pages of the report can be navigated using the tabs.
You can add new sections to the report from the New tab that appears below the design area. You can also add new sections by right-clicking the Section tab and selecting the Insert option from the context menu. To duplicate the report section, select the Duplicate option from the context menu. You can also delete the section by selecting the Delete option.

You can use a slider that allows to scroll the tabs horizontally. This slider appears if a report has many sections, which tabs do not fit into the page.
The report sections can be added to the viewer's Document Map for ease of navigation through the report. To do so, simply set the report section’s Label property. For more information, see the Document Map topic.
To control the visibility of the initial state of the section, use the Hidden property from the Properties panel and enter a Boolean value or an expression that evaluates to a Boolean value. See Hide or Show Sections in RDLX and RDLX Dashboard Reports for more information.
Scrollable Container Component
The Container control in the RDLX Dashboard Report is scrollable. You can manage the scroll behavior by using the Overflow property. See Container Control in RDLX Dashboard Report for more information.
Actionable Items Provide Extensive Interactivity
The Action property in report controls and data regions makes the dashboards highly interactive and helps slice and dice the report metrics. You can click on an action and see the action. The action works across dashboard pages too.
If in addition, there is action(s) set on control(s) inside a Table cell, List, or BandedList, that action will be given priority over the action set on the Table's row, List data region, and BandedList's band.
type=note
Note: Since RDLX Dashboard reports have a page-less view, the page-related properties or expressions such as Page Totals, Page Numbers, and Page Breaks, are not supported.
Preview Limitations for Standalone and Visual Studio Integrated Designers
It is suggested to use JSViewer or WebDesigner preview for viewing RDLX Dashboard reports due to the following limitations at the moment:
It is not possible to switch between report sections (sections are rendered as separate pages).
Scrollable regions are not supported at preview.


