- Introduction
- Report Readers
-
Report Authors
- Standalone Designer
- WebDesigner
- Report Types
- Report Controls
- Report Wizard
- Data Binding
-
Design Reports
-
Design Page/RDLX Reports
- Layout
- Report Dialog
- Master Report (RDLX Report)
- Layers
- Expressions
- Data Visualizers
- Filters
- Groups
- Interactivity
- Scripts
- Report Appearance
-
Tutorials: Report Controls in Page/RDLX Reports
- TableofContent Control for Navigation
- BandedList Data Region for Free-form Bands
- Bullet Control to Visualize Sales against Target
- CheckBox Control
- OverflowPlaceholder Control for Columnar Reports
- InputField Control for Editable PDFs
- Line Control for Freehand Forms
- List Control for Hierarchical Relationships
- Table Data Region for a Tabular Report
- Shape Control for Enhanced Report Appearance
- Image Control
- Container Control for Enhanced Report Appearance
- FormattedText Control for Mail Merge
- Subreport Control for a Master-Detail Report
- Sparkline Control
- Tablix Data Region
- TextBox Control
- Map Data Region
- Tutorials: Page/RDLX Report Scenarios
- Design Section Reports
-
Design Page/RDLX Reports
- DevOps
- Developers
- Samples
- Troubleshooting
Container Control for Enhanced Report Appearance
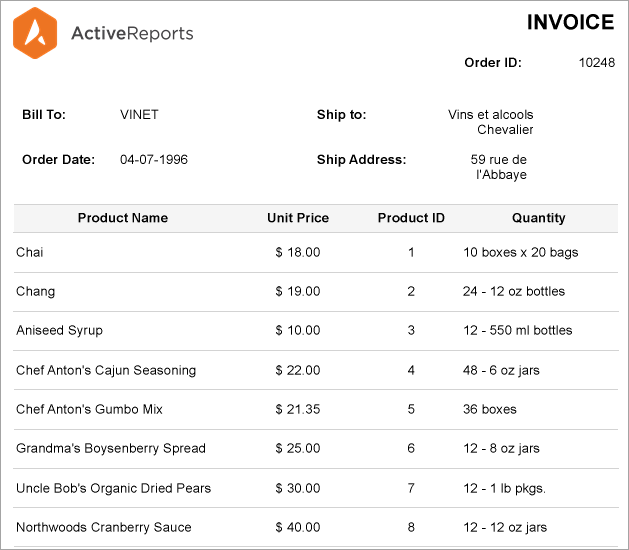
Let us enhance the appearance of the following report using Container controls.

The Invoice report shown above contains the company logo and the invoice issue information, the shipping and billing information, and the products information.
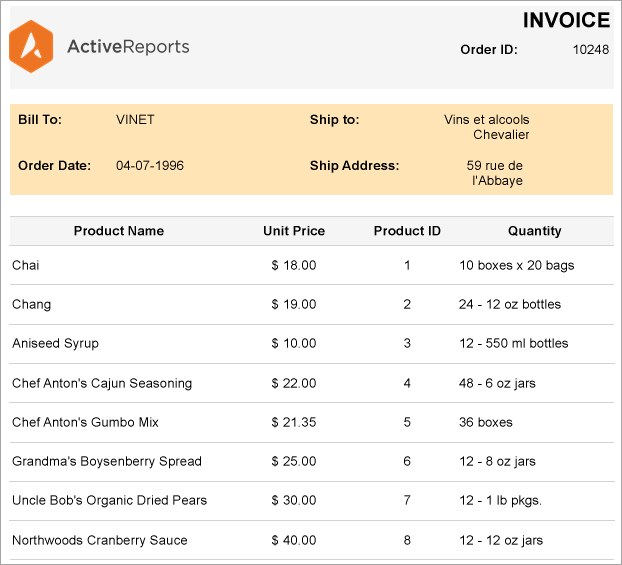
We will re-create the above report to improve its appearance by using two Container controls. The containers will be placed so as to highlight the two parts of the invoice: the first Container to visually group the company logo and the invoice issue information, while the second Container to highlight the shipping and billing information.
Design Report Layout
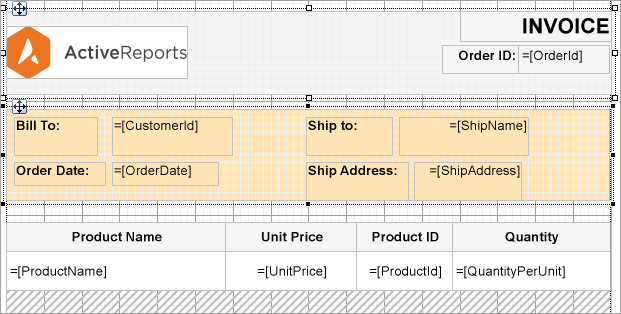
- Drag and drop a Container control onto the design area of the Report Designer.
- Set the following properties to some values, for example: Width, Height, and Color.
- Drag and drop Image controls into the Container and add the company logo.
- To add information on order Id, drag-drop the [OrderId] field from the dataset. Also add text boxes on the container to add the labels 'Order ID:' and 'INVOICE'.
- To highlight the shipping and billing information, drag-drop another Container control and place it below the first Container control. Set its properties to some values, for example: Width, Height, and Color.
- Drag and drop the following data fields from the dataset on the second Container control: [CustomerId], [OrderDate], and [ShipName].
- Now, add text boxes to add labels above the data fields: 'Bill To:', 'Order Date:', 'Ship To:', and 'Ship Address:'.
- Drag-drop the Table data region onto the report designer, below the second Container control.
- Bind the text boxes in the Table's Details row to [ProductName], [UnitPrice], [ProductID], and [Quantity].
- Modify the appearance of the report and preview.


