
- Introduction
- Report Readers
-
Report Authors
- Standalone Designer
- WebDesigner
- Report Types
-
Report Controls
-
Report Controls in Page/RDLX Report
- BandedList
- Barcode
- Bullet
-
Chart
- Chart Wizard
- Chart Smart Panels and Adorners
-
Plots
- Column and Bar Charts
- Area Chart
- Line Chart
- Pie and Doughnut Charts
- Scatter and Bubble Charts
- Radar Scatter and Radar Bubble Charts
- Radar Line Chart
- Radar Area Chart
- Spiral Chart
- Polar Chart
- Gantt Chart
- Funnel and Pyramid Charts
- Candlestick Chart
- High Low Close Chart
- High Low Open Close Chart
- Range Charts
- Gauge Chart
- Axes
- Legends
- Customize Chart Appearance
- Trendlines
- Classic Chart
- CheckBox
- Container
- ContentPlaceHolder (RDLX Master Report)
- FormattedText
- Image
- InputField
- Line
- List
- Map
- Matrix
- Overflow Placeholder (Page report only)
- Shape
- Sparkline
- Subreport
- Table
- Table of Contents
- Tablix
- TextBox
- Report Controls in Section Report
-
Report Controls in Page/RDLX Report
- Report Wizard
- Data Binding
- Design Reports
- DevOps
- Developers
- Samples
- Troubleshooting
Funnel and Pyramid Charts
Funnel Chart
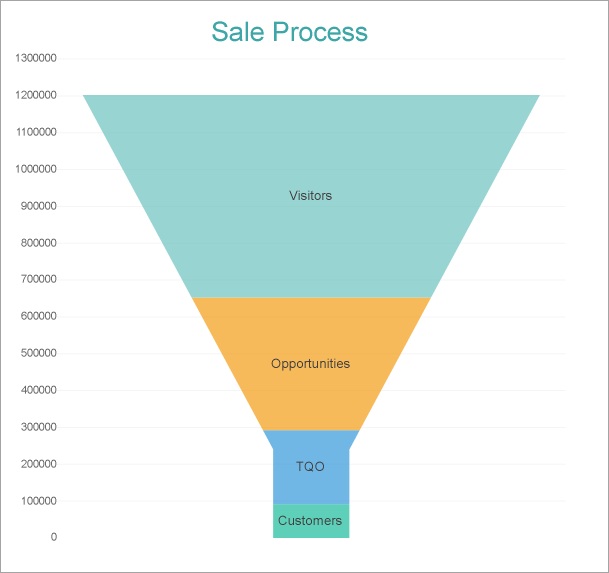
A Funnel chart helps in visualizing sequential stages in a linear process such as the flow of users via a sales or business process. The chart takes its name from the funnel shape it has - which starts with a broad head and ends with a narrow neck. The number of users at different process stage are indicated by the width of the funnel.
Funnel charts can help identify potential problem areas in processes where it is noticeable at what stages and rate the values decrease. A real-time use case for Funnel Charts can be an order fulfillment process scenario, which tracks the number of orders getting across a stage, such as orders received, processed, approved, released, shipped, completed, and delivered. Each stage in such a process represents a percentage or proportion of the total. That's the reason why the chart takes a funnel shape with the first stage being the largest and the consecutive stage smaller than the predecessor.
A Funnel chart arranges related values stacked on top of one another.
The Create Funnel Chart walkthrough showcases plotting parameters like Visitors, Opportunities, Total Quality Organization, and Customers.
Stacked Funnel Chart
Pyramid Chart
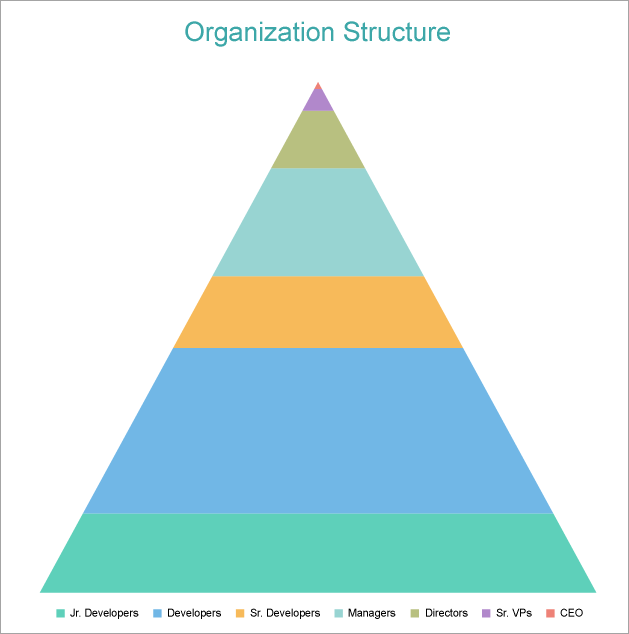
A Pyramid chart is an easy-to-understand chart type, which can be used to depict directional workflows or hierarchies. The Pyramid chart is beneficial for organizing and visualizing data and explaining internal business management structures or workflows. A Pyramid chart can quickly communicate processes, hierarchies, and relationships between categories of information.
A Pyramid chart arranges each series vertically stacked one over the other. The Create Pyramid Chart walkthrough showcases plotting the Sales Amount for each Product Category per Sales Channel.
Stacked Pyramid Chart
Funnel and Pyramid Plot Properties
The plot properties discussed below can be accessed from the Properties Panel on selecting the Chart > Plot from the Report Explorer. You can access some of the important properties from the Plot's Smart Panel too. See Chart Smart Panels topic for more information. Both the Properties Panel and the Smart Panel can be accessed by right-clicking the plot in the design area.