
- Introduction
- Report Readers
-
Report Authors
- Standalone Designer
- WebDesigner
- Report Types
-
Report Controls
-
Report Controls in Page/RDLX Report
- BandedList
- Barcode
- Bullet
-
Chart
- Chart Wizard
- Chart Smart Panels and Adorners
-
Plots
- Column and Bar Charts
- Area Chart
- Line Chart
- Pie and Doughnut Charts
- Scatter and Bubble Charts
- Radar Scatter and Radar Bubble Charts
- Radar Line Chart
- Radar Area Chart
- Spiral Chart
- Polar Chart
- Gantt Chart
- Funnel and Pyramid Charts
- Candlestick Chart
- High Low Close Chart
- High Low Open Close Chart
- Range Charts
- Gauge Chart
- Axes
- Legends
- Customize Chart Appearance
- Trendlines
- Classic Chart
- CheckBox
- Container
- ContentPlaceHolder (RDLX Master Report)
- FormattedText
- Image
- InputField
- Line
- List
- Map
- Matrix
- Overflow Placeholder (Page report only)
- Shape
- Sparkline
- Subreport
- Table
- Table of Contents
- Tablix
- TextBox
- Report Controls in Section Report
-
Report Controls in Page/RDLX Report
- Report Wizard
- Data Binding
- Design Reports
- DevOps
- Developers
- Samples
- Troubleshooting
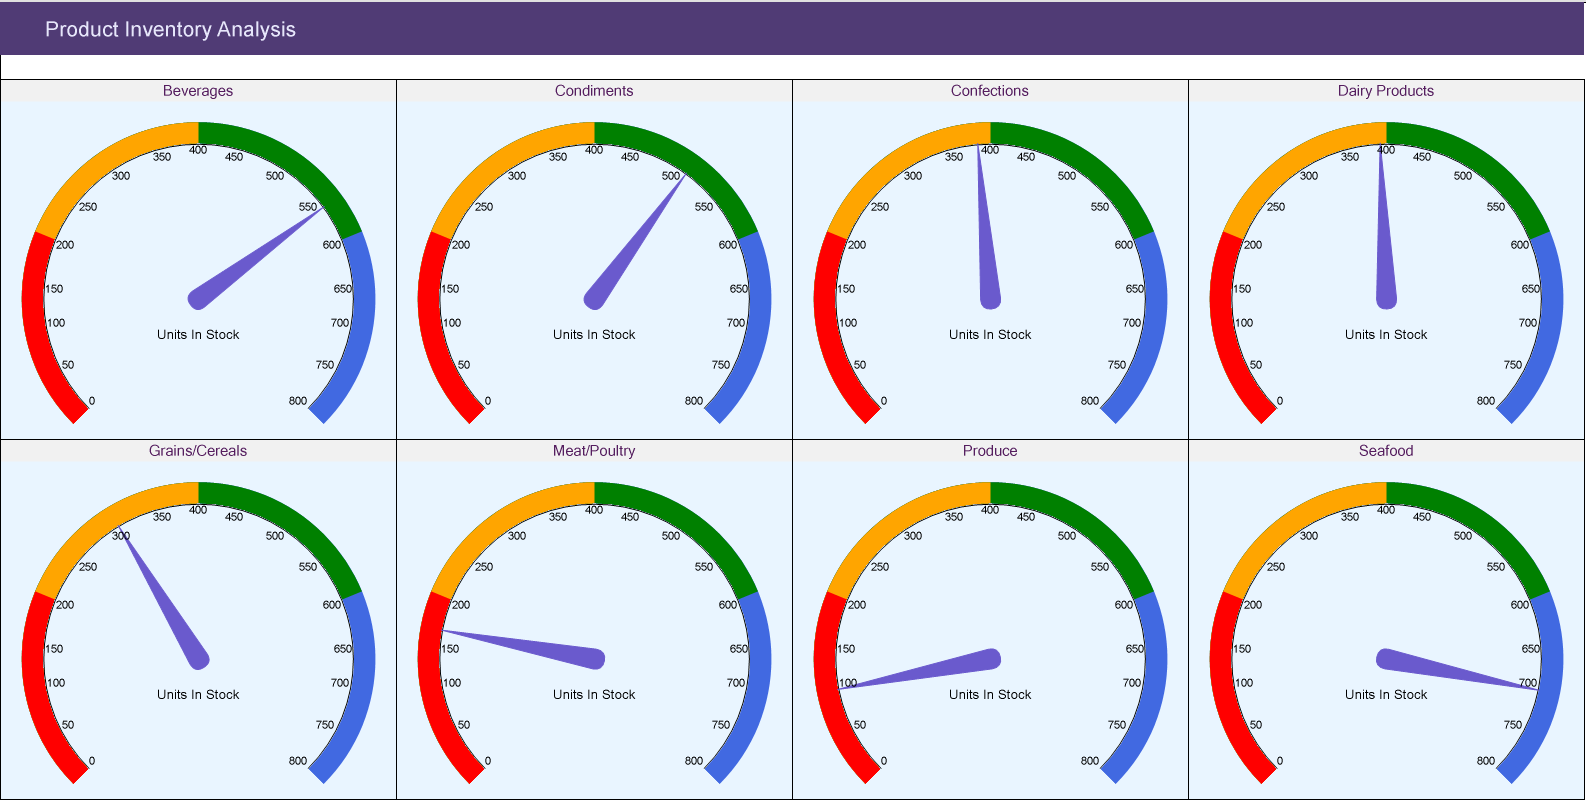
Gauge Chart
A Gauge chart is a Bar chart with a radial axis and overlapping bars to show ranges. It uses the needle and the dial to represent the data. The direction of the needle and the colors in the dial shows the performance at a glance.
Gauge Chart