WebDesigner
ActiveReports WebDesigner is based on the HTML5/JS technology stack. The designer is an integrated reporting application that comes packed with a powerful yet intuitive user interface that facilitates users to create summarized and structured reports anywhere on any device. The designer supports all types of reports that a desktop designer supports - RDLX, RDLX Dashboard, Page, and Section.
WebDesigner Interface
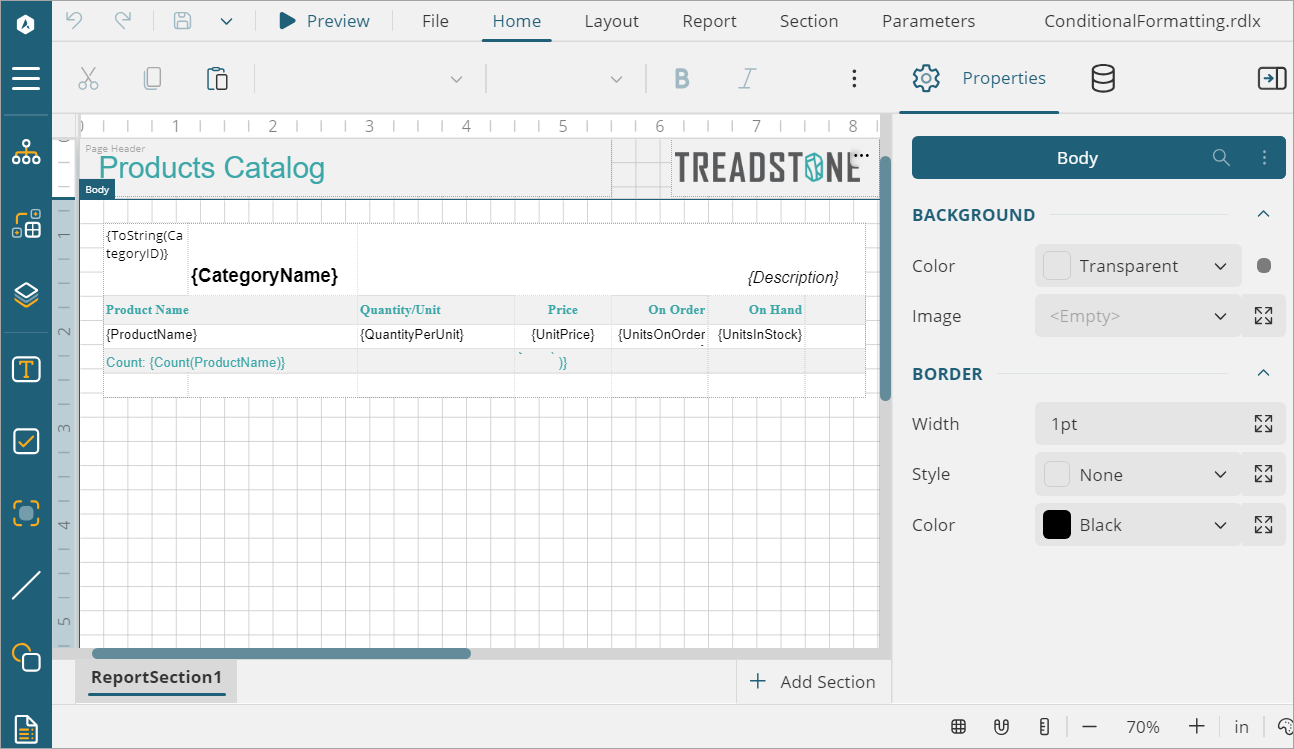
The UI of WebDesigner Interface consists of the following regions:

Ribbon Tabs
The ribbon on the designer window consists of the following tabs:

Undo/Redo: Undo or redo actions on the designer.
Save/Save as: Lets you save the report.
File: Contains options to create, open, or save all types of reports - Page report, RDLX report (+Master report), and Section report.
Preview: Shows the report preview.
Home: Consists of report editing options such as cut, copy, paste, and delete. It also provides shortcuts for text formatting such as font, font size, Text color, Background color and horizontal and vertical text alignments.
Layout: Contains options to align to grid, size to grid, bring to front, send to back and other alignment, sizing, and spacing options.
Report: Contains options to add continuous section, convert to master report, set master report (in RDLX report), switch themes, add, delete, hide, or move pages (in Page report), and add or remove header and footer (in Section report).
Section: Enables only in the RDLX report. It contains the options to add header or footer and add or move section.
Script: Enables you to use a VB.NET or C# script to port your custom logic to report layouts. This permits layout saved to report XML (.rpx) files to serve as standalone reports.
type=note
Note: Following points must be noted in WebDesigner as compared to ActiveReports Designer control (see link):
Script tab is not available for any report except Section report. Users can still work with scripts, but cannot add or edit them directly.
The built-in code editor is currently a simple text area without any additional functionality like syntax highlighting.
Dashboard: Contains options to add, move, hide, duplicate sections and switch theme. This tab is available for the RDLX Dashboard Report only.
Parameters: Contains the design area for designing a custom parameter panel. The controls making the panel have default properties set, like name, label, default value, etc.
Menu Button
The Menu on the designer window contains the explorer, group editor, layers and report controls that assist in designing reports. You can preview the report by clicking on the Preview button.

Explorer: Provides an overview of the hierarchy of added report items. It displays the current selection and allows for the selection of other report items. The section names in Section report can also be viewed in the Explorer. To resize any section, use the Properties panel.
Group Editor: Shows column and row hierarchies of Tablix members for the currently selected Tablix or Table data region.
Layers: Opens the Layers List window that displays a list of layers in the report along with their possibility and lock options. See Layers for details.
Report Controls: Report controls to be used while creating a report. For an RDLX report, the report controls available are: TextBox, CheckBox, Container, Line, Shape, Table Of Contents, Image, List, Table, Tablix, Chart, Bullet, Barcode, Formatted Text, Sparkline, Subreport, Banded list, and Input Field.
Properties tab
The Properties tab is located on the right-hand side of the app. Click the tab to view the Properties panel, which displays the properties of the designer or the selected report element. If more than one element is selected, only their common properties are shown.
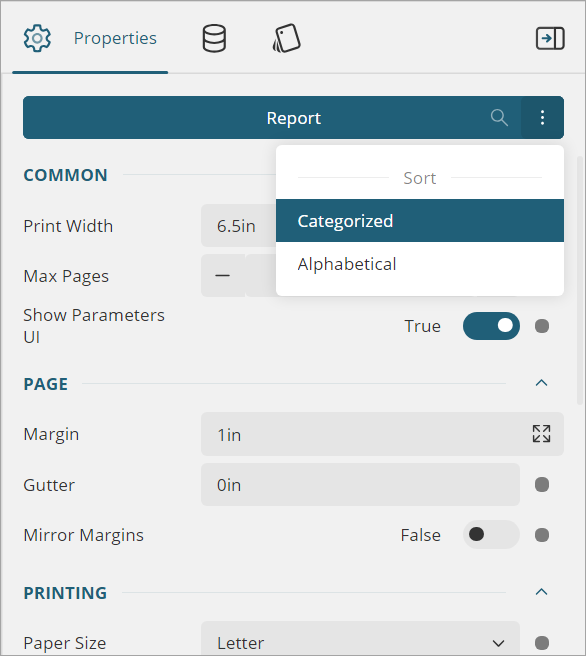
You can sort the properties in Section report using the vertical ellipses in the Properties tab, as shown:

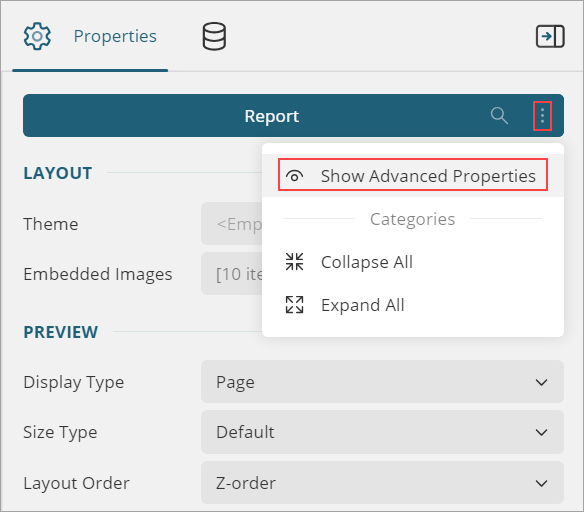
In RDLX and Page reports, by default only basic set of properties are displayed. To view advanced properties, you need to change the property mode using the vertical ellipses in the Properties tab, as shown:

Data tab
Data tab is located next to the properties tab. It manages the data sources, data sets, parameters, and subreports. It also displays common values such as the current date and time, page number, total pages, and more.
Style Sheet tab
It contains styles, which are a set of properties that you can apply to selected controls in your reports to quickly change their appearance. In EUD you must open report’s properties dialog to edit the style sheet. In WebDesigner we have a separate tab for that.
type=note
Note: Style Sheet tab is available only for the Section report.
Designer Buttons
Designer Buttons: Designer buttons consist of options to change the appearance and behavior of the design area:
Grid: Click this option to show or hide the grid. Grids help in accurate placements of controls.
Grid Size, Snap to Grid, and Snap to Guides: Grid Size allows you to specify the size of the grid. When the Snap to Grid option is enabled, the selected control snaps to the grid at set locations. When the Snap to Guides option is enabled, the selected control snaps to the vertical or horizontal lines relative to the position of other controls. This is helpful for consistent spacing and alignment of controls.
type=note
Note: Snap to Guides option is not supported in Section report's design area.
Ruler (disabled by default): When the ruler is enabled, you can drag the ruler's markers to change the report margins.
Zoom support: Using the zoom in (+) and zoom out (-) buttons, you can change the zoom level of the design area. You can also use shortcuts [Ctrl] + [+] to zoom in and [Ctrl] + [-] to zoom out.
Ruler Units: Lets you change the ruler measurements for a report to Centimeters (cm) or Inches (in) using ruler units.
Theme Picker: Lets you change the theme of the designer from the 'System Theme' and the themes defined via API.
Preview
When the user clicks the Preview button, a Preview window opens as shown below:

The Preview toolbar consists of the following elements:
Go To First: Navigates to the first page of the report.
Go to Previous: Navigates to the previous page.
Go To Next: Navigates to the next page.
Go To Last: Navigates to the last page of the report.
Refresh: Refreshes the report.
History: Back To Parent: Navigates to the parent report (only available for drill through report)
History: Go Back: Navigates to the previous page in the drill through report.
History: Go to Forward: Navigates to the next page in the drill through report.
Move Tool: Allows you to change the visible part of a page if it does not fit on the screen.
Zoom support: Changes the zoom level of the design area by using zoom in (+) and zoom out (-) buttons, or by using shortcuts [Ctrl] + [+] to zoom in and [Ctrl] + [-] to zoom out.
Toggle Fullscreen: Toggles the full screen.
Print: Prints the report.
Single Page View: Shows one page of the report at a time.
Continuous View: Shows all pages of the report one below the other.
Galley Mode: Shows RDLX reports by removing automatic page break and displaying data in a single scrollable page.
Keyboard Shortcuts
The following shortcuts are available in the WebDesigner.
Keyboard Shortcut | Action |
|---|---|
Ctrl + A | Selects all cells in the Table and Tablix controls. In the List, Body and Container controls, selects all controls in the current container. |
Ctrl + E | Opens the New Report page. |
Ctrl + O | Opens the Open Report page. |
Ctrl + S | Opens the Save Report page. |
Ctrl + Z | Undoes the last action. |
Ctrl + Y | Redoes the last action. |
Ctrl + X | Cuts text and controls. |
Ctrl + C | Copies text and controls. |
Ctrl + V | Pastes text and controls. |
Del | Deletes text and controls. |
Left, Right, Up, Down arrow keys | Moves the visible area of the page in the corresponding direction. In the Table and Tablix controls, navigates between the cells. When controls inside List and Container controls and in the Body of the report are selected, arrow keys allow moving controls by grid-size. In the Chart Control, arrow keys move data-fields and category-fields. |
Tab | Navigates in the forward direction between the cells in the Table and Tablix controls. When controls inside List and Container controls and in the Body of the report are selected, Tab key switches between controls in the forward direction. |
Shift + Tab | Navigates in the backward direction between the cells in the Table and Tablix controls. When controls inside List and Container controls and in the Body of the report are selected, Shift + Tab switches between controls in the backward direction. |


