
- Introduction
- Report Readers
-
Report Authors
- Standalone Designer
- WebDesigner
- Report Types
-
Report Controls
-
Report Controls in Page/RDLX Report
- BandedList
- Barcode
- Bullet
-
Chart
- Chart Wizard
- Chart Smart Panels and Adorners
-
Plots
- Column and Bar Charts
- Area Chart
- Line Chart
- Pie and Doughnut Charts
- Scatter and Bubble Charts
- Radar Scatter and Radar Bubble Charts
- Radar Line Chart
- Radar Area Chart
- Spiral Chart
- Polar Chart
- Gantt Chart
- Funnel and Pyramid Charts
- Candlestick Chart
- High Low Close Chart
- High Low Open Close Chart
- Range Charts
- Gauge Chart
- Axes
- Legends
- Customize Chart Appearance
- Trendlines
- Classic Chart
- CheckBox
- Container
- ContentPlaceHolder (RDLX Master Report)
- FormattedText
- Image
- InputField
- Line
- List
- Map
- Matrix
- Overflow Placeholder (Page report only)
- Shape
- Sparkline
- Subreport
- Table
- Table of Contents
- Tablix
- TextBox
- Report Controls in Section Report
-
Report Controls in Page/RDLX Report
- Report Wizard
- Data Binding
- Design Reports
- DevOps
- Developers
- Samples
- Troubleshooting
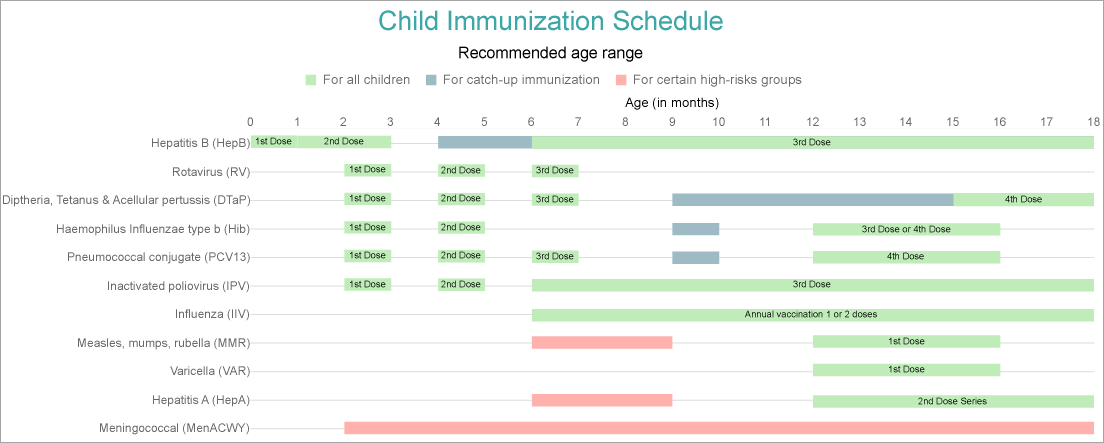
Gantt Chart
A Gantt chart is a common chart type used in project management. Gantt plots provide the most useful ways of displaying activities (tasks or events) against time periods. Gantt charts can also be used to schedule big projects by breaking them into tasks and subtasks. The Gantt plot helps lay the tasks and subtasks on a timeline. In the Gantt chart, each task is listed on the chart's one side and each has a horizontal bar opposite it corresponding to the task length. By using the Gantt chart, you can find out how long each task will take and which tasks can overlap.
See Create Gantt Chart walkthrough to learn how the immunization schedule can be laid out using the Gantt chart.
A Gantt chart is made of essential elements, such as:
- Task: An activity involved in the project.
- Start: The date or time when the task execution begins.
- End: The date or time when the task execution ends.