
- Introduction
- Report Readers
-
Report Authors
- Standalone Designer
- WebDesigner
- Report Types
- Report Controls
- Report Wizard
- Data Binding
-
Design Reports
-
Design Page/RDLX Reports
- Layout
- Report Dialog
- Master Report (RDLX Report)
- Layers
- Expressions
- Data Visualizers
- Filters
- Groups
- Interactivity
- Scripts
- Report Appearance
- Tutorials: Report Controls in Page/RDLX Reports
-
Tutorials: Page/RDLX Report Scenarios
- Create RDLX Dashboard Report
- Create Multi-Column Layout (or Columnar report)
- Create Top N Report
- Create a Red Negatives or a Green Bar Report
- Apply Theme at Runtime Using Dynamic Expression
- Add Page Numbering
- Show Row Number in Tablix and Table
- Link Multiple Datasets to Same Data Region
- Localize RDLX Report Content
- Design Section Reports
-
Design Page/RDLX Reports
- DevOps
- Developers
- Samples
- Troubleshooting
Link Multiple Datasets to Same Data Region
Many a time, we need to display varied data from different datasets into one data region. This is now possible by using the Lookup function in a data region.
The Lookup function returns a value corresponding to a related or a common field with the same data type in another data set. It is set as an expression in the Value property of a data region's Textbox. The Lookup function in ActiveReports is similar to the Microsoft Excel's VLOOKUP.
Create a Report
In the ActiveReports Designer, create a new Page Report.
Bind Report to Data
As you create a new report, the Report Data Source dialog appears for you to configure the report data connection. You can also access this dialog by right-clicking the Data Sources node in the Report Explorer and then selecting the Add Data Source option.
In the dialog, select the General page and enter a name for the data source.
Select 'SQLite Provider'. The report connects to the SalesResult.db file can be downloaded from GitHub: ..\Samples19\Data\SalesResult.db. See Configure ActiveReports using Config file for more information.
Add Dataset1
In the Report Explorer, right-click the data source node and select the Add Data Set option or select Data Set from the Add button.
In the Add Dataset that appears, select the General page and let the name of the dataset be Dataset1. This name appears as a child node to the data source icon in the Report Explorer.
On the Query page of this dialog, in the Query field enter the following SQL query.
SELECT M01Product.Category, M01Product.ProductID
FROM M01Product
Click the Validate DataSet icon
at the top right hand corner above the Query box to validate the query.
Click OK to close the dialog. Your data set and queried fields appear as nodes in the Report Explorer.
The Dataset1 contains following fields:
Category
ProductID
Add Dataset2
Repeat Steps 1 and 2 to add another dataset with name Dataset2.
On the Query page of this dialog, in the Query field enter the following SQL query.
SELECT * FROM T01ResultClick the Validate DataSet icon
at the top right hand corner above the Query box to validate the query.Click OK to close the dialog. Your data set and queried fields appear as nodes in the Report Explorer.
The Dataset2 contains following fields:
ID
ProductID
Quantity
PDate
FY
Design Report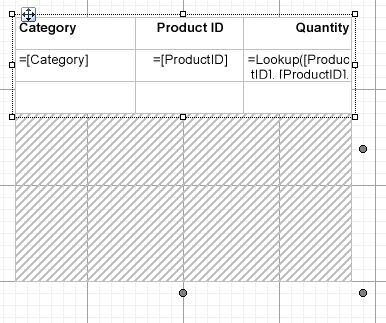
From the toolbox, drag a Table data region onto the design surface of the report.
Go to the Properties panel to set the properties of Table data region as follows:
Property Name
Property Value
FixedSize
4in, 4in
Location
0in, 0in
DataSetName
Dataset1
Hover your mouse over the text boxes of the Table Details row to access the field selection adorner and set the following fields in the table cells along with their properties.
Cell
Field
TextBox4
Category
TextBox5
ProductID
This automatically places an expression in the details row and simultaneously places a static label in the header row of the same column.
Select TextBox6 of the Table data region and from the Properties pane, set the following properties:
Property Name
Property Value
Value
=Lookup(Fields!ProductID.Value, Fields!ProductID.Value, Fields!Quantity.Value, "DataSet2")
TextAlign
Left
The expression in the Value property returns the value of Quantity from Dataset2, corresponding to the related data field ProductID in Dataset1.
Select TextBox3 of the Table data region and from the Properties pane, set the following properties:
Property Name
Property Value
Value
Quantity
TextAlign
Left
Select the header row using the row handle to the left and in the Properties Panel, set the FontWeight property to Bold.
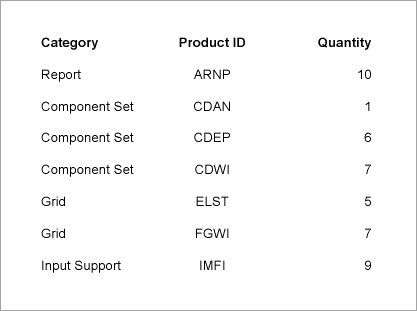
Preview Report
The final report is shown at the beginning of this page.