
- Introduction
- Report Readers
-
Report Authors
- Standalone Designer
- WebDesigner
- Report Types
-
Report Controls
- Report Controls in Page/RDLX Report
- Report Controls in Section Report
- Report Wizard
- Data Binding
- Design Reports
- DevOps
- Developers
- Samples
- Troubleshooting
Legends
A Legend in a Chart data region helps a user understand the data plots easily. A legend is connected to the data which is being graphically displayed in the plot area of the chart and is an especially useful tool to analyze data in the case of multiple series.
Several legend types depending on the Chart type are available.
Line plots support all types of legends. Column, Bar, and Area plots support only the Color legend. Scatter plots support Color and Shape legends. Bubble plots support Color and Size, since the shape is circular. The financial charts, on the other hand, do not support any legend series because they do not contain groups.
Color Legend
The color legend displays the match between the plot subsections's fill or stroke color and the corresponding data value subcategories. Almost all types of plot support this legend. See Create Clustered Polar Chart walkthrough.
You can configure the appearance of Color Legend using the properties given below.
BackgroundColor: Indicates the color of the background.
Border: Represents the border settings.
Hidden: Indicates whether the legend is hidden.
MaxHeight: Represents the maximum height of the element in percentage.
MaxWidth: Represents the maximum width of the element in percentage.
Orientation: The Orientation property determines the direction of legend item's appearance:
- Horizontal: from left to right
- Vertical: from top to bottom
Padding: You could also set the Padding between the legend box and its content. This will automatically increase the legend size.
Position: The Position value sets the location of the legend relative to the plot area.
Title: The string Expression determines the legend heading.
TextStyle and TitleStyle: The TextStyle and TitleStyle properties aid in styling the legend's Text and Title, respectively. The TextStyle and TitleStyle consist of the following settings:
- Color: Adds the color for the Text or Title.
- Font: Adds the FontFamily, FontSize, FontStyle and FontWeight.
- TextDecoration: Adds a line under, over or through the text.
Action: Chart color action.
Mode: Specifies how legend items are populated.
- Data Values: Data points are colored based on the data values.
- Series Groups: Data points are colored based on the series groups.
- Custom: To set custom legend, you should set the expression for the legend series in Custom Expression property.
Shape Legend
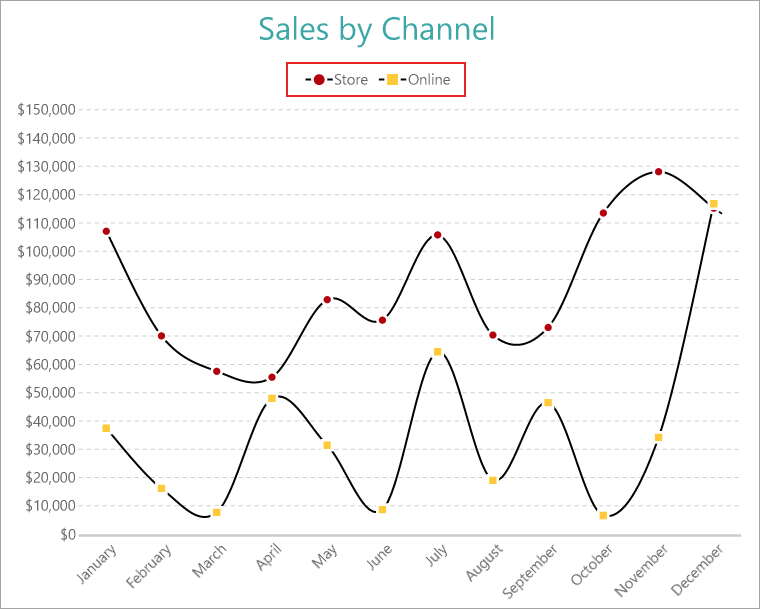
The Shape Legend shows the relationship between the shape of data point symbols and corresponding subcategories of a value in the plot data. Consider the Create Multiple Line Chart walkthrough.
With the [Sales Amount] field selected from the Chart Data area, go to the Properties panel and set Appearance > Marker > Shape to 'Auto'. You can change the shape property to see the effects.
You can configure the appearance of Shape Legend using the properties given below.
BackgroundColor: Indicates the color of the background.
Border: Represents the border settings.
Hidden: Indicates whether the legend is hidden.
IconColor: Represents the color of the legend icon shape.
MaxHeight: Represents the maximum height of the element in percentage.
MaxWidth: Represents the maximum width of the element in percentage.
Orientation: The Orientation property determines the direction of legend item's appearance:
- Horizontal: from left to right
- Vertical: from top to bottom
Padding: Represents the amount of padding to place between the text or graphics and the edge of the report item.
Position: Represents the legend position.
Title: The string Expression determines the legend heading.
TextStyle and TitleStyle: The TextStyle and TitleStyle properties aid in styling the legend's Text and Title, respectively. The TextStyle and TitleStyle consist of the following settings:
- Color: Adds the color for the Text or Title.
- Font: Adds the FontFamily, FontSize, FontStyle and FontWeight.
- TextDecoration: Adds a line under, over or through the text.
Mode: Specifies how legend items are populated.
- Series Groups: Data points are colored based on the series groups.
- Custom: To set custom legend, you should set the expression for the legend series in Custom Expression property.
Size Legend
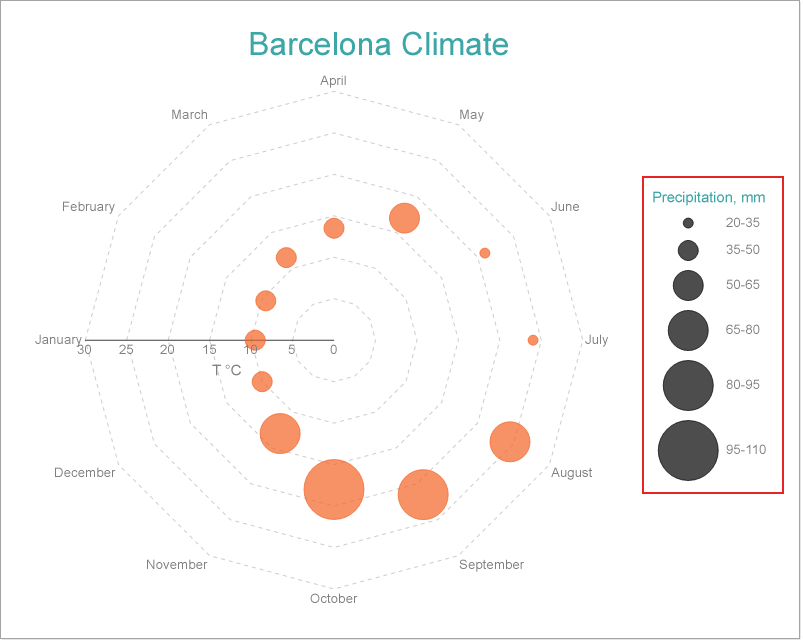
The Size Legend shows the match between the size of data point symbols and corresponding subcategories of a data value. You need to configure the Size Encoding of a plot to depict the Size Legend. The Create Radar Bubble Chart walkthrough illustrates setting up a Size Legend.
You can configure the appearance of Size Legend using the properties given below.
BackgroundColor: Indicates the color of the background.
Border: Represents the border settings.
Hidden: Indicates whether the legend is hidden.
IconColor: Represents the color of the legend icon shape.
MaxHeight: Represents the maximum height of the element in percentage.
MaxWidth: Represents the maximum width of the element in percentage.
Orientation: The Orientation property determines the direction of legend item's appearance:
- Horizontal: from left to right
- Vertical: from top to bottom
Padding: Represents the amount of padding to place between the text or graphics and the edge of the report item.
Position: Represents the legend position.
Ranges: Represents the collection of ranges for size legend.
TextStyle and TitleStyle: The TextStyle and TitleStyle properties aid in styling the legend's Text and Title, respectively. The TextStyle and TitleStyle consist of the following settings:
- Color: Adds the color for the Text or Title.
- Font: Adds the FontFamily, FontSize, FontStyle and FontWeight.
- TextDecoration: Adds a line under, over or through the text.
Action: Chart color action.
Mode: Specifies how legend items are populated.
- Series Groups: Data points are colored based on the series groups.
- Custom: To set custom legend, you should set the expression for the legend series in Custom Expression property.