- Introduction
- Report Readers
-
Report Authors
- Standalone Designer
- WebDesigner
- Report Types
-
Report Controls
- Report Controls in Page/RDLX Report
- Report Controls in Section Report
- Report Wizard
- Data Binding
- Design Reports
- DevOps
- Developers
- Samples
- Troubleshooting
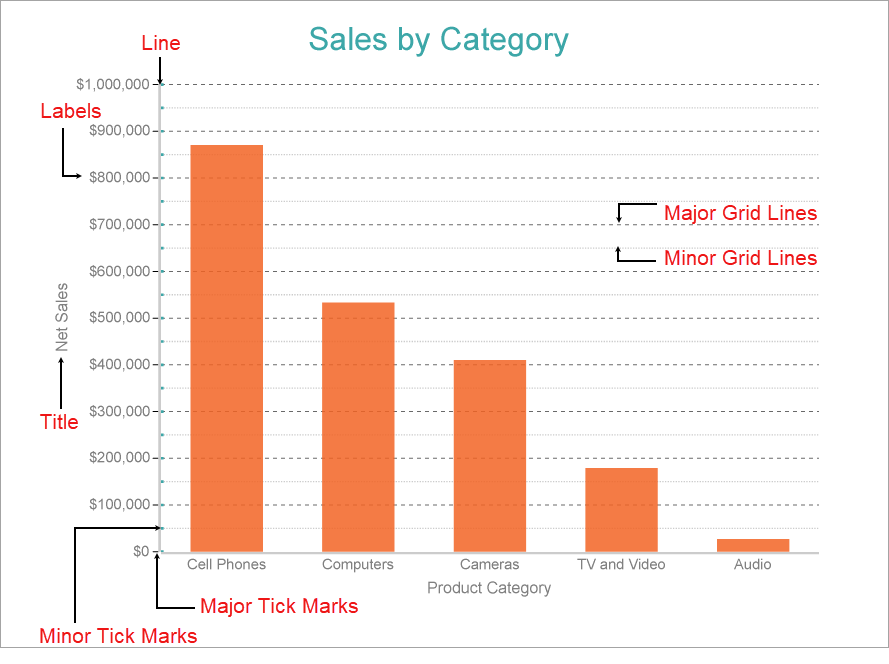
Axes
Being an essential part of most chart types, the Axis can perform the following functions:
Provide a coordinate system for one or multiple plots.
Display measuring units for the data to be visualized.
Produce the grid lines.
General Axis Properties
Appearance
Height: Represents the height of the Axis in percentage relative to the overall chart height. This property is applicable to the horizontal axis.
MaxHeight: Represents the maximum height of the Axis in percentage relative to the overall chart height. This property applies to the horizontal axis and its default value is 100%.
MaxWidth: Represents the maximum width of the Axis in percentage relative to the overall chart width. This property applies to the vertical axis and its default value is 100%.
Width: Represents width of the Axis in percentage relative to the overall chart width. This property applies to the vertical axis.
See the section Set Position of Axis to know about customizing the position of Y-axis.
Common
AxisType: Designates the type of Axis, whether be it X or Y.
DateMode: Axis Date mode to set the size of the time span of the axis. This property works only in these charts when they do not have any categories: Bar, Scatter, Line, Area, Range area, Range bar, Text, Funnel, Pyramid, HLOC, Candlestick, Pie, and Donut.
Plots: Designates the plot in which the X or Y axis exists.
Labels
Show Labels: Indicate whether to show or hide axis labels.
Format: Represents the formatting string used for rendering dates and numbers.
Label Angle: Represents the rotation angle of axis labels in degrees.
Label Angle applies only when Label Layout is set to
None. For other layout options, this setting is ignored.
Writing Mode: The horizontal (lr-tb) or vertical direction (tb-rl) of the label text. The default value is lr-tb (left to right top to bottom). If set to tb-lr (top to bottom left to right), the chart axis labels appear vertically
Label Layout: Determines how axis labels are arranged when they do not fit within the available space. The available options are None, Default, Clip, Ellipsis, and Wrap.
Label Row Count: Sets the number of rows for axis labels, ranging from 1 to 10 for a multi-row arrangement. This property is supported in Column, Area, Line, Scatter, Bubble, Candlestick, High Low Close, High Low Open Close, Range Column, and Range Area charts, for X-Axis.
Label Row Count applies only when Label Layout is set to
None. For other layout options, this setting is ignored.
Labels Style: Represents the style of the axis labels
Color: The label text color.
Font: The font properties for the label.
Padding: The padding to place between the label text and the axis.
TextDecoration: The decorative lines on the label text.
Layout
Origin: Represents the value or ordinal number at which both the axes cross each other.
Overlapping: Indicates whether the labels can be overlapped.
Position: Indicates the axis position.
Far
Near
None
Reversed: Indicates whether the axis is reversed from top to bottom, or left to right.
Line
LineStyle: Select the style of the line.
LineColor: The line color.
LineStyle: The style of the line.
LineWidth: The width of the line.
ShowLine: Indicates whether or not to show the line.
Major Grid
MajorGridInterval: Number of units between the major axis ticks.
MajorGridStyle: Style of the major gridline.
MajorTickMark: Location of the major grid tick marks, inside the plot area, outside the plot area, or across the axis.
MajorTickSize: Length of the major grid tick marks.
MajorTickStyle: Style of the major grid ticks.
ShowMajorGrid: Indicates whether or not to show the major gridlines.
Minor Grid
MinorGridInterval: Number of units between minor axis ticks.
MinorGridStyle: Style of the minor grid line.
MinorTickMark: Location of the minor grid line tick marks, inside the plot area, outside the plot area, or across the axis.
MinorTickSize: Length of the minor gridline tick marks.
MinorTickStyle: Style of the minor grid ticks.
ShowMinorGrid: Indicates whether or not to show the minor gridlines.
Scale
LogarithmicBase: Represents the axis logarithmic base for logarithmic scale.
Max: Shows the maximum axis value.
Min: Shows the minimum axis value.
Scale: Represents the scale of the axis.
Linear: In the Linear scale type, the values are evenly distributed along the axis. It is the default scale type. The Create Clustered Bar Chart walkthrough sets the Linear scale on Y-axis.
Logarithmic: In the Logarithmic scale type, the axis uses the logarithm of values rather than the values themselves. This scale type is best suitable for displaying a wide range of numerical values in a compact manner. When using a logarithmic scale, the axis can use a logarithmic base. The Create Simple Polar Chart walkthrough sets the Logarithmic scale on Y-axis.
Ordinal: In the Ordinal scale type, the values are evenly distributed along the axis according to their order. It applies to non-numerical values like product categories.
Percentage: In the Percentage scale, the values are represented as a percentage. The Create Stacked Percentage Area Chart walkthrough sets the Percentage scale on Y-axis.
Title
Title: Represents the title of the axis.
TitleStyle: Represents the styling of the Axis Title.
Color: The title color.
Font: The font properties for the title.
Padding: The padding to place between the title and the axis.
TextDecoration: The decorative lines on the title.
User Scenario
Set Position of Axis
A set of four properties for the X and Y axes - Width, MaxWidth, Height, and MaxHeight help users to control the position of the axes by specifying the height and width values for the X and Y axes, and their corresponding maximum values up to which the axes can grow. If the length of the data labels and titles in a chart exceeds the specified maximum height and width, labels are clipped-off. These properties are used to align a chart with the other controls or data regions.
Note that when a user does not specify these properties, the height and width for the chart axes are calculated automatically depending on the bound data. If the user wants to set the exact Y-axis position, the 'Width' and 'MaxWidth' properties should be set to one value. This value should be found by the user at design time.
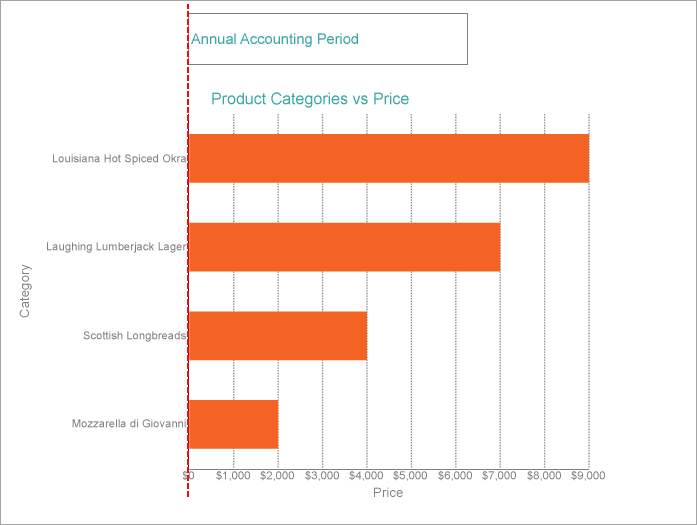
Let us see how to align the vertical axis of a Chart data region relative to a Textbox control on the same page. The below image shows how the chart appears with the following properties set for the vertical axis.
MaxWidth: 100%
Width: Default
The steps to set the Y-Axis position of the chart are as follows.
From the Report Explorer, go to Chart > Plot Area and select Y Axis - [Plot1].
In the Properties window, go to Appearance > Width property and enter a suitable value.
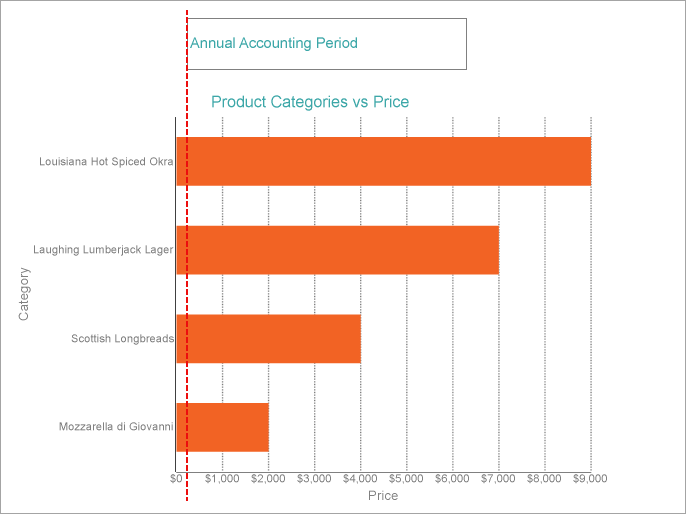
In our case, 30% aligns the Y-Axis with the TextBox control.
Preview the report.
The below image shows how the vertical axis of the chart is aligned with the textbox after the 'Width' property is set to a suitable value observed at the design time: